
Warren Buffett Stock Portfolio Based on Big Data: Returns up to 80.16% in 1 Year
Warren Buffett Stock Portfolio
This Warren Buffett Stock Portfolio is part of the Buffett’s Top 10 Package, as one of I Know First’s quantitative investment solutions. Investors generally utilize the I Know First advanced self-learning algorithm to take advantage of Warren Buffett’s proven investing strategy. The full Top 10 Warren Buffett’s Stocks Package includes the best stocks identified by the algorithm that are currently in Warren Buffett’s portfolio:
- Top 10 Warren Buffett’s stocks for long position
- Top 10 Warren Buffett’s stocks for short position

Package Name: Warren Buffett Portfolio
Recommended Positions: Long
Forecast Length: 1 Year (10/18/20 – 10/18/21)
I Know First Average: 38.27%
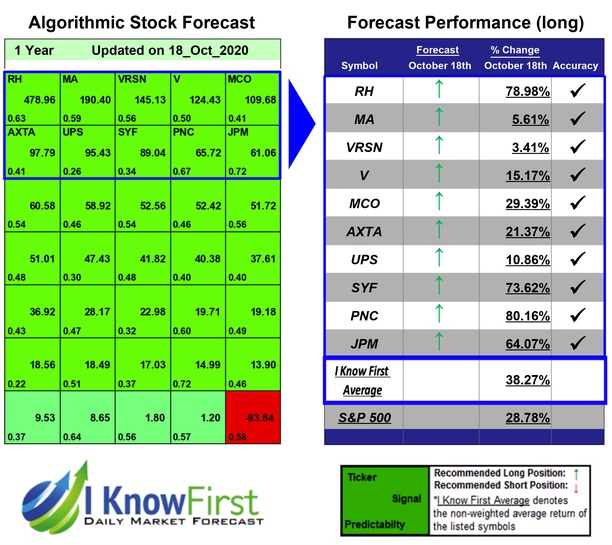

The algorithm correctly predicted 10 out 10 of the suggested trades in the Warren Buffett Portfolio Package for this 1 Year forecast. The highest trade return came from PNC, at 80.16%. Further notable returns came from RH and SYF at 78.98% and 73.62%, respectively. The overall average return in this Warren Buffett Portfolio package was 38.27%, providing investors with a 9.49% premium over the S&P 500’s return of 28.78% during the same period.
The PNC Financial Services Group, Inc. operates as a diversified financial services company in the United States and internationally. The company’s Retail Banking segment offers deposit, lending, brokerage, investment management, and cash management services to consumer and small business customers through branch network, ATMs, call centers, online banking, and mobile channels. As of March 31, 2016, this segment operated a network of 2,613 branches and 8,940 ATMs. Its Corporate & Institutional Banking segment provides secured and unsecured loans, letters of credit, equipment leases, cash and investment management, receivables management, disbursement and funds transfer, information reporting, trade services, foreign exchange, derivatives, securities, loan syndications, mergers and acquisitions advisory, equity capital markets advisory, and related services for corporations, government, and not-for-profit entities. This segment also offers commercial loan servicing, and real estate advisory and technology solutions for the commercial real estate finance industry. The company’s Asset Management Group segment provides investment and retirement planning, customized investment management, private banking, tailored credit solutions, and trust management and administration for individuals and their families; multi-generational family planning products; and mutual funds and institutional asset management services. Its Residential Mortgage Banking segment offers first lien residential mortgage loans. The company’s BlackRock segment provides investment and risk management services to institutional and retail clients. Its Non-Strategic Assets Portfolio segment offers consumer residential mortgage, brokered home equity loans, and lines of credit, as well as commercial real estate loans and leases. The PNC Financial Services Group, Inc. was founded in 1922 and is headquartered in Pittsburgh, Pennsylvania.
Algorithmic traders utilize these daily forecasts by the I Know First market prediction system as a tool to enhance portfolio performance, verify their own analysis and act on market opportunities faster. This forecast was sent to current I Know First subscribers.
How to interpret this diagram
Algorithmic Stock Forecast: The table on the left is a stock forecast produced by I Know First’s algorithm. Each day, subscribers receive forecasts for six different time horizons. Note that the top 10 stocks in the 1-month forecast may be different than those in the 1-year forecast. In the included table, only the relevant stocks have been included. The boxes are arranged according to their respective signal and predictability values (see below for detailed definitions). A green box represents a positive forecast, suggesting a long position, while a red represents a negative forecast, suggesting a short position.
Please note-for trading decisions use the most recent forecast. Get today’s forecast and Top stock picks.


