
Warren Buffett Stock Portfolio Based on Algo Trading: Returns up to 10.35% in 3 Days
Warren Buffett Stock Portfolio
This Warren Buffett Stock Portfolio is part of the Buffett’s Top 10 Package, as one of I Know First’s quantitative investment solutions. Investors generally utilize the I Know First advanced self-learning algorithm to take advantage of Warren Buffett’s proven investing strategy. The full Top 10 Warren Buffett’s Stocks Package includes the best stocks identified by the algorithm that are currently in Warren Buffet portfolio:
- Top 10 Warren Buffett’s stocks for long position
- Top 10 Warren Buffett’s stocks for short position

Package Name: Warren Buffett Portfolio
Recommended Positions: Long
Forecast Length: 3 Days (11/15/2019 – 11/18/2019)
I Know First Average: 1.39%
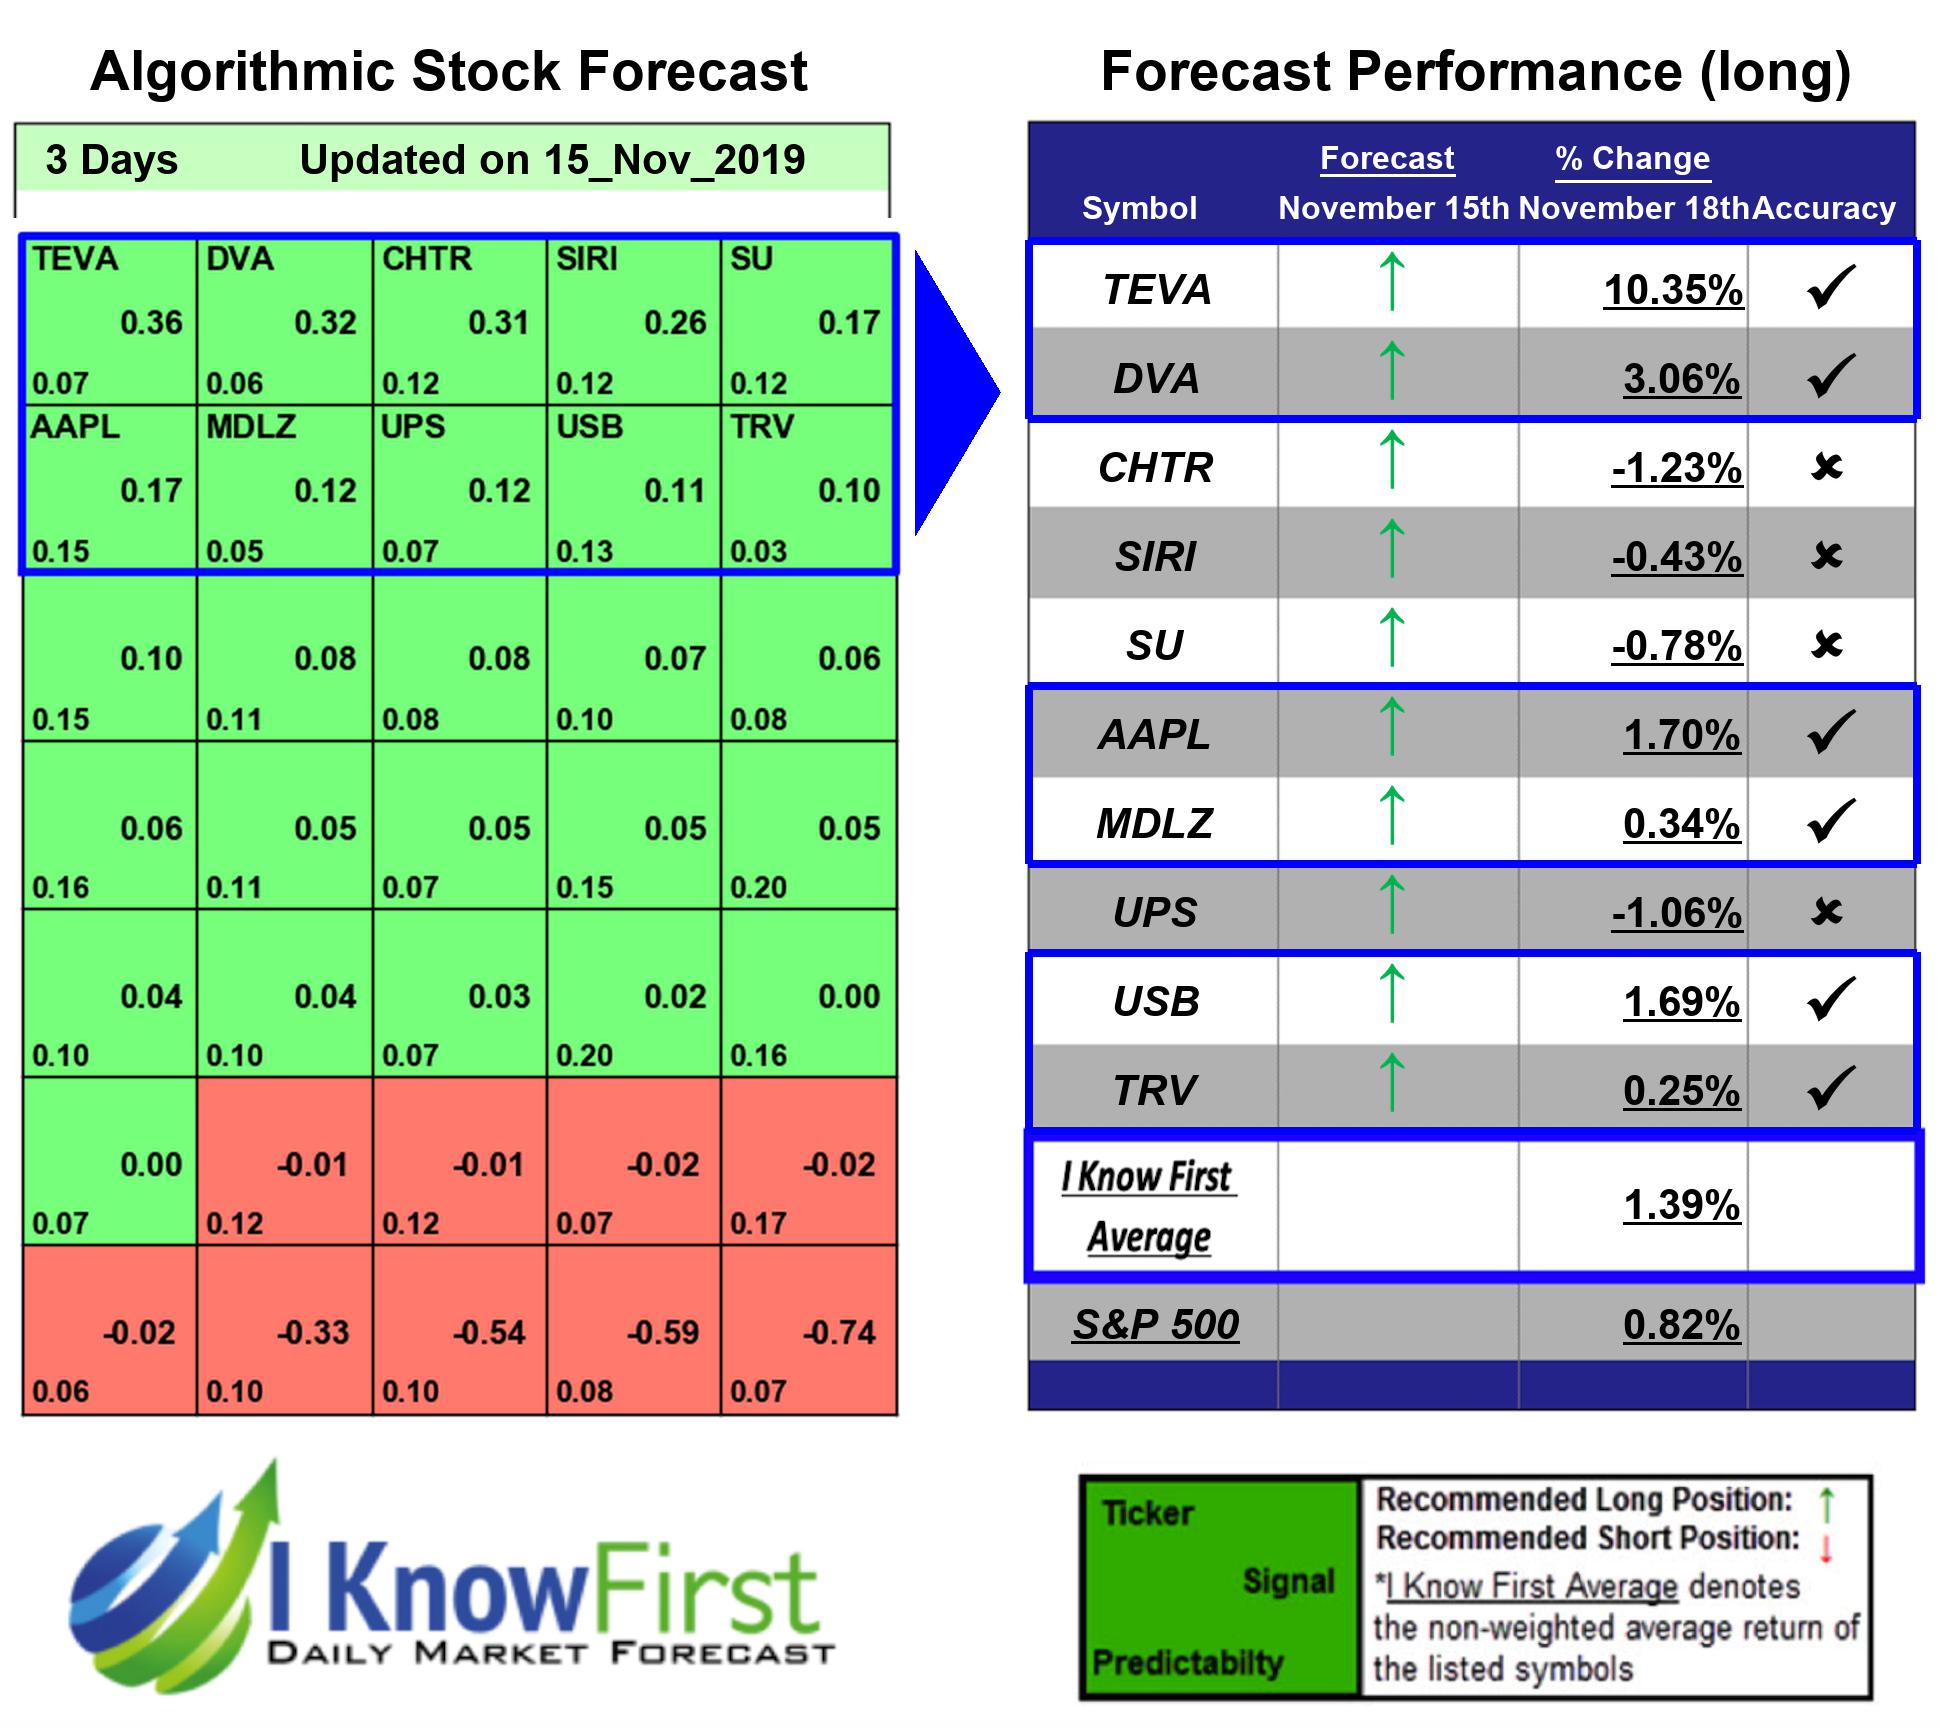
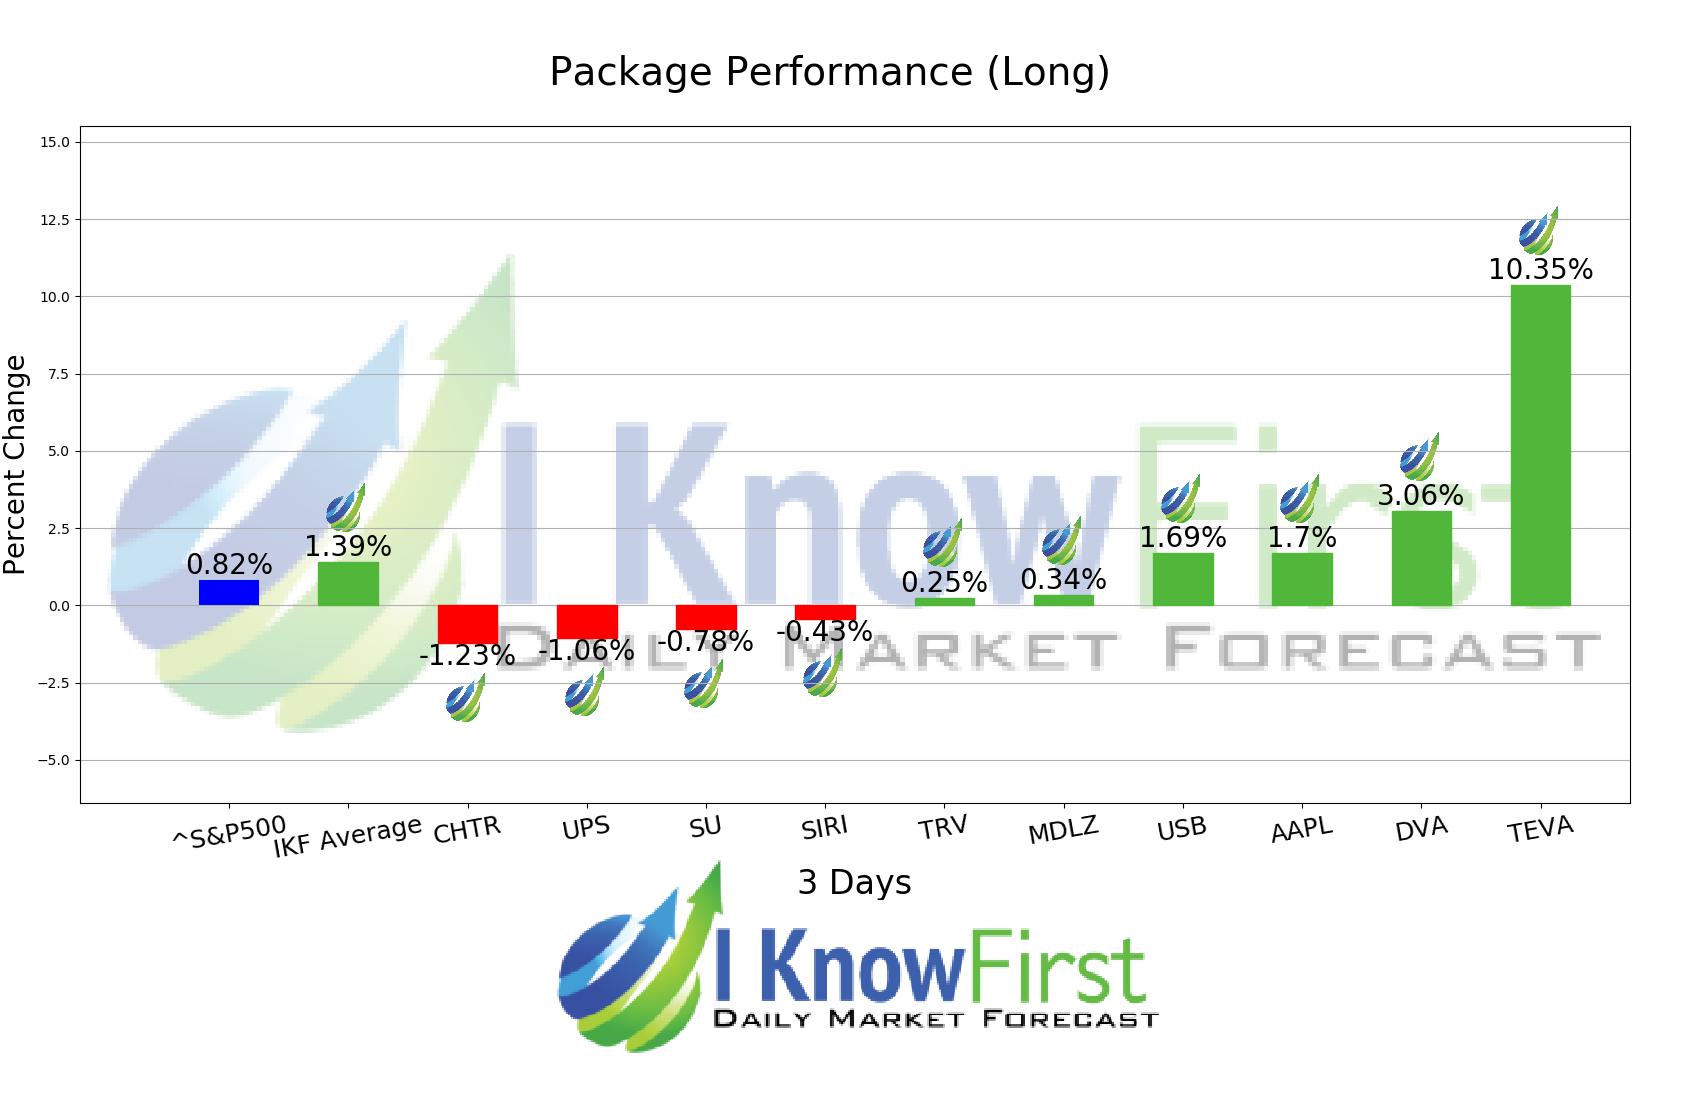
The algorithm correctly predicted 6 out 10 of the suggested trades in the Warren Buffett Stock Portfolio Package for this 3 Days forecast. The highest trade return came from TEVA, at 10.35%. DVA, and AAPL had notable returns of 3.06% and 1.7%. This algorithmic forecast package presented an overall return of 1.39% versus S&P 500’s performance of 0.82% providing a market premium of 0.57%.
Teva Pharmaceutical Industries Limited (TEVA) develops, manufactures, markets, and distributes generic medicines and a portfolio of specialty medicines worldwide. The company’s Generic Medicines segment offers generic medicines, such as sterile products, hormones, narcotics, high-potency drugs, and cytotoxic substances in various dosage forms, including tablets, capsules, injectables, inhalants, liquids, ointments, and creams. This segment also develops, manufactures, and sells active pharmaceutical ingredients. The company’s Specialty Medicines segment provides branded specialty medicines for use in central nervous system and respiratory indications, as well as the women’s health, oncology, and other specialty businesses. Its products in the central nervous system area comprise Copaxone for multiple sclerosis; Azilect for the treatment of Parkinson’s disease; Nuvigil for the treatment of excessive sleepiness associated with narcolepsy and certain other disorders; Fentora/Effentora for the treatment of breakthrough pain in opioid-tolerant adult patients with cancer; and Zecuity, a prescription transdermal system for the acute treatment of migraine with or without aura in adults. This segment’s products in the respiratory market include ProAir, ProAir Respiclick, QVAR, and Duoresp Spiromax for the treatment of asthma and chronic obstructive pulmonary disease, as well as Treanda, Granix, Trisenox, Synribo, Lonquex, Myocet, Eporatio, Tevagrastim/Ratiograstim, and Trisenox products in the oncology market. This segment also offers a portfolio of products in the women’s health category, which includes ParaGard, Plan B One-Step, OTC/Rx, Zoely, Seasonique, and Ovaleap, as well as other products. Teva Pharmaceutical Industries Limited (TEVA) has collaboration arrangements with Takeda Pharmaceutical Company Limited, Procter & Gamble Company, Intel, and Regeneron Pharmaceuticals, Inc. The company was founded in 1901 and is headquartered in Petach Tikva, Israel.
Algorithmic traders utilize these daily forecasts by the I Know First market prediction system as a tool to enhance portfolio performance, verify their own analysis and act on market opportunities faster. This forecast was sent to current I Know First subscribers.
How to interpret this diagram
Algorithmic Stock Forecast: The table on the left is a stock forecast produced by I Know First’s algorithm. Each day, subscribers receive forecasts for six different time horizons. Note that the top 10 stocks in the 1-month forecast may be different than those in the 1-year forecast. In the included table, only the relevant stocks have been included. The boxes are arranged according to their respective signal and predictability values (see below for detailed definitions). A green box represents a positive forecast, suggesting a long position, while a red represents a negative forecast, suggesting a short position.
Please note-for trading decisions use the most recent forecast. Get today’s forecast and Top stock picks.


