
Volatility Trading Based on Deep-Learning: Returns up to 127.22% in 7 Days
Volatility Trading
This Volatility trading forecast is designed for investors and analysts who need predictions of the implied volatility for a basket of put and call options related to a specific index. It includes 8 volatility indices with bullish and bearish signals and indicates the best Volatility Index to trade:
- Volatility indices for the long position
- Volatility indices for the short position

Package Name: Volatility Forecast
Recommended Positions: Long
Forecast Length: 7 Days (3/10/2020 – 3/17/2020)
I Know First Average: 32.67%
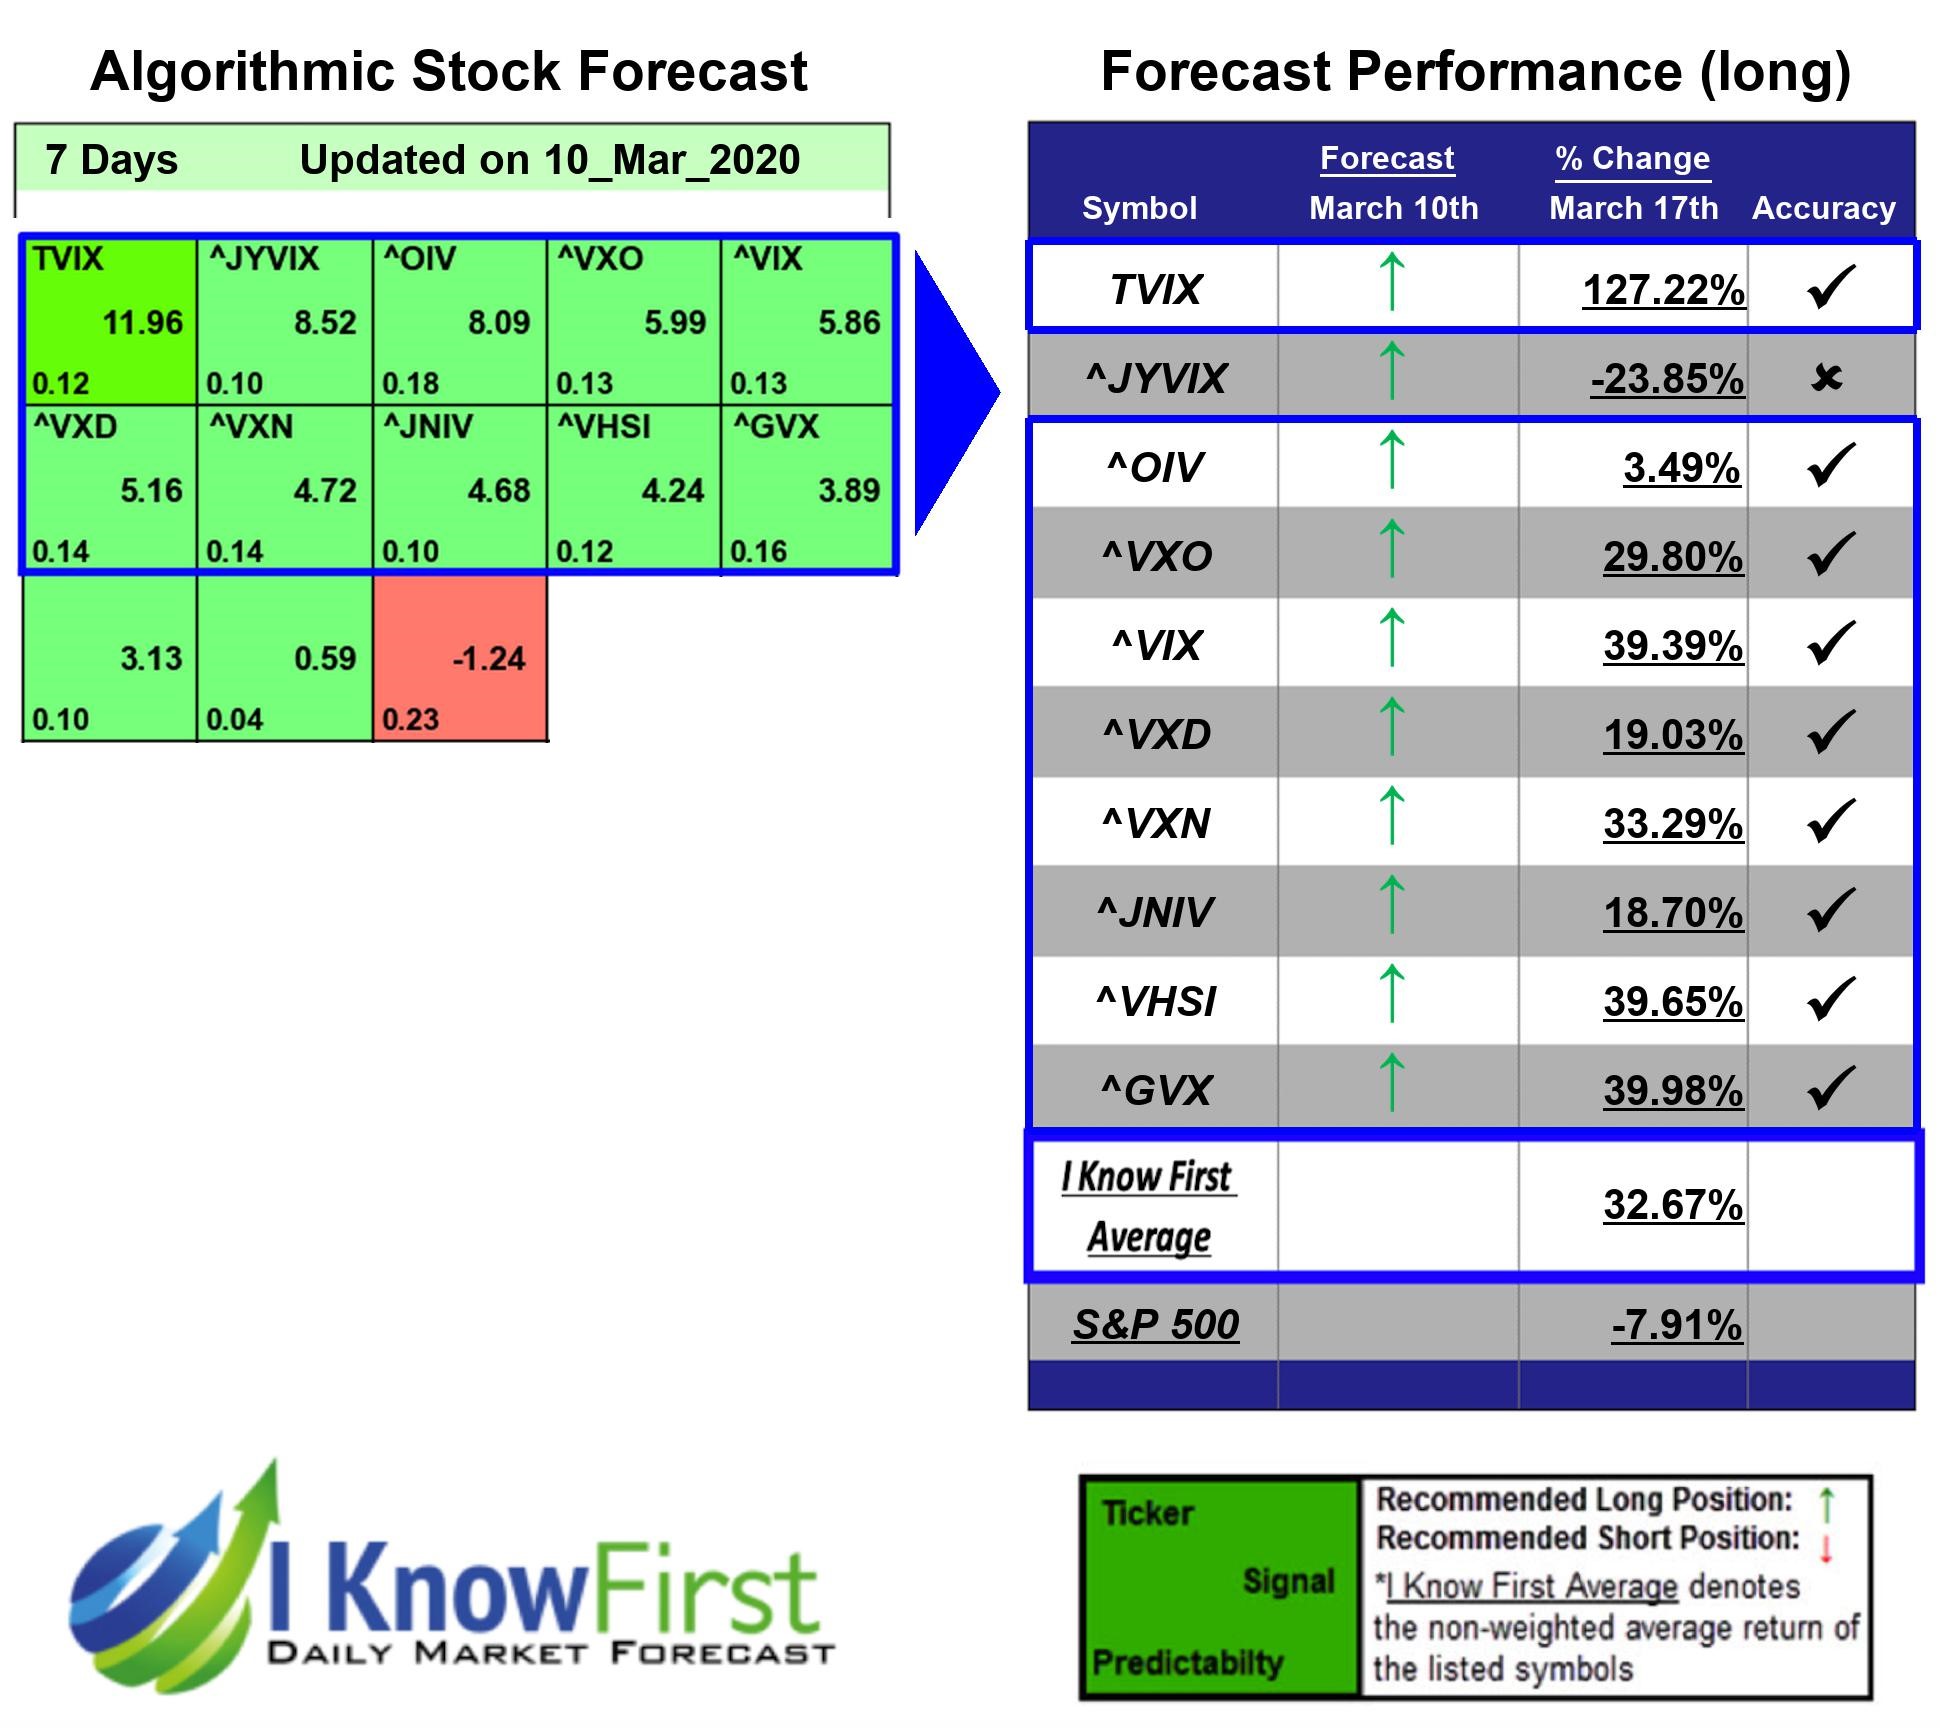
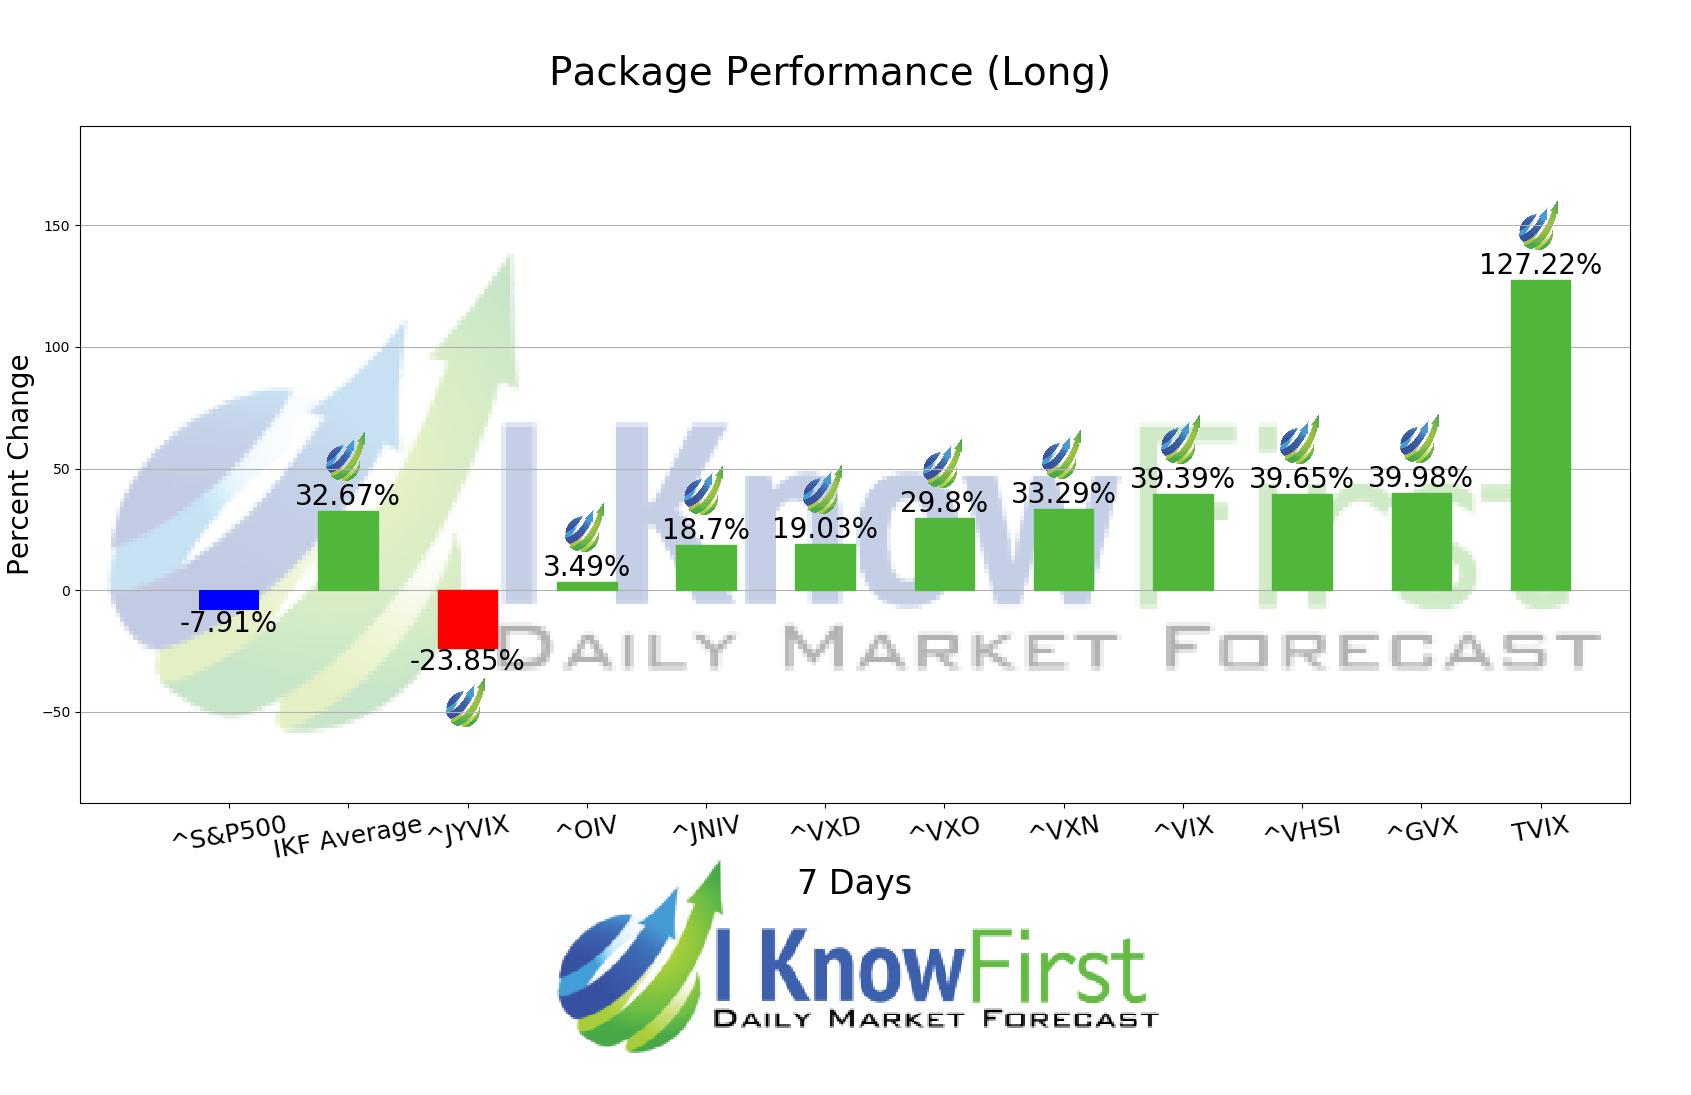
9 out of 10 stock prices in this forecast for the Volatility Forecast Package moved as predicted by the algorithm. TVIX was our best stock pick this week a return of 127.22%. Other notable stocks were ^GVX and ^VHSI with a return of 39.98% and 39.65%. With these notable trade returns, the package itself registered an average return of 32.67% compared to the S&P 500’s return of -7.91% for the same period.
Credit Suisse AG – VelocityShares Daily 2x VIX Short Term ETN (TVIX) (TVIX) is an exchange-traded note issued by Credit Suisse AG (Nassau Branch). They follows twice the daily percentage return of the S&P 500 VIX Short-Term Futures index performance.
Algorithmic traders utilize these daily forecasts by the I Know First market prediction system as a tool to enhance portfolio performance, verify their own analysis and act on market opportunities faster. This forecast was sent to current I Know First subscribers.
How to interpret this diagram
Algorithmic Stock Forecast: The table on the left is a stock forecast produced by I Know First’s algorithm. Each day, subscribers receive forecasts for six different time horizons. Note that the top 10 stocks in the 1-month forecast may be different than those in the 1-year forecast. In the included table, only the relevant stocks have been included. The boxes are arranged according to their respective signal and predictability values (see below for detailed definitions). A green box represents a positive forecast, suggesting a long position, while a red represents a negative forecast, suggesting a short position.
Please note-for trading decisions use the most recent forecast. Get today’s forecast and Top stock picks.


