
Volatility Prediction Based on Data Mining: Returns up to 29.62% in 3 Days
Volatility Prediction
This Volatility prediction is designed for investors and analysts who need predictions of the implied volatility for a basket of put and call options related to a specific index. It includes 8 volatility indices with bullish and bearish signals and indicates the best Volatility Index to trade:
- Volatility indices for the long position
- Volatility indices for the short position

Package Name: Volatility Forecast
Recommended Positions: Long
Forecast Length: 3 Days (1/24/2020 – 1/28/2020)
I Know First Average: 13.35%
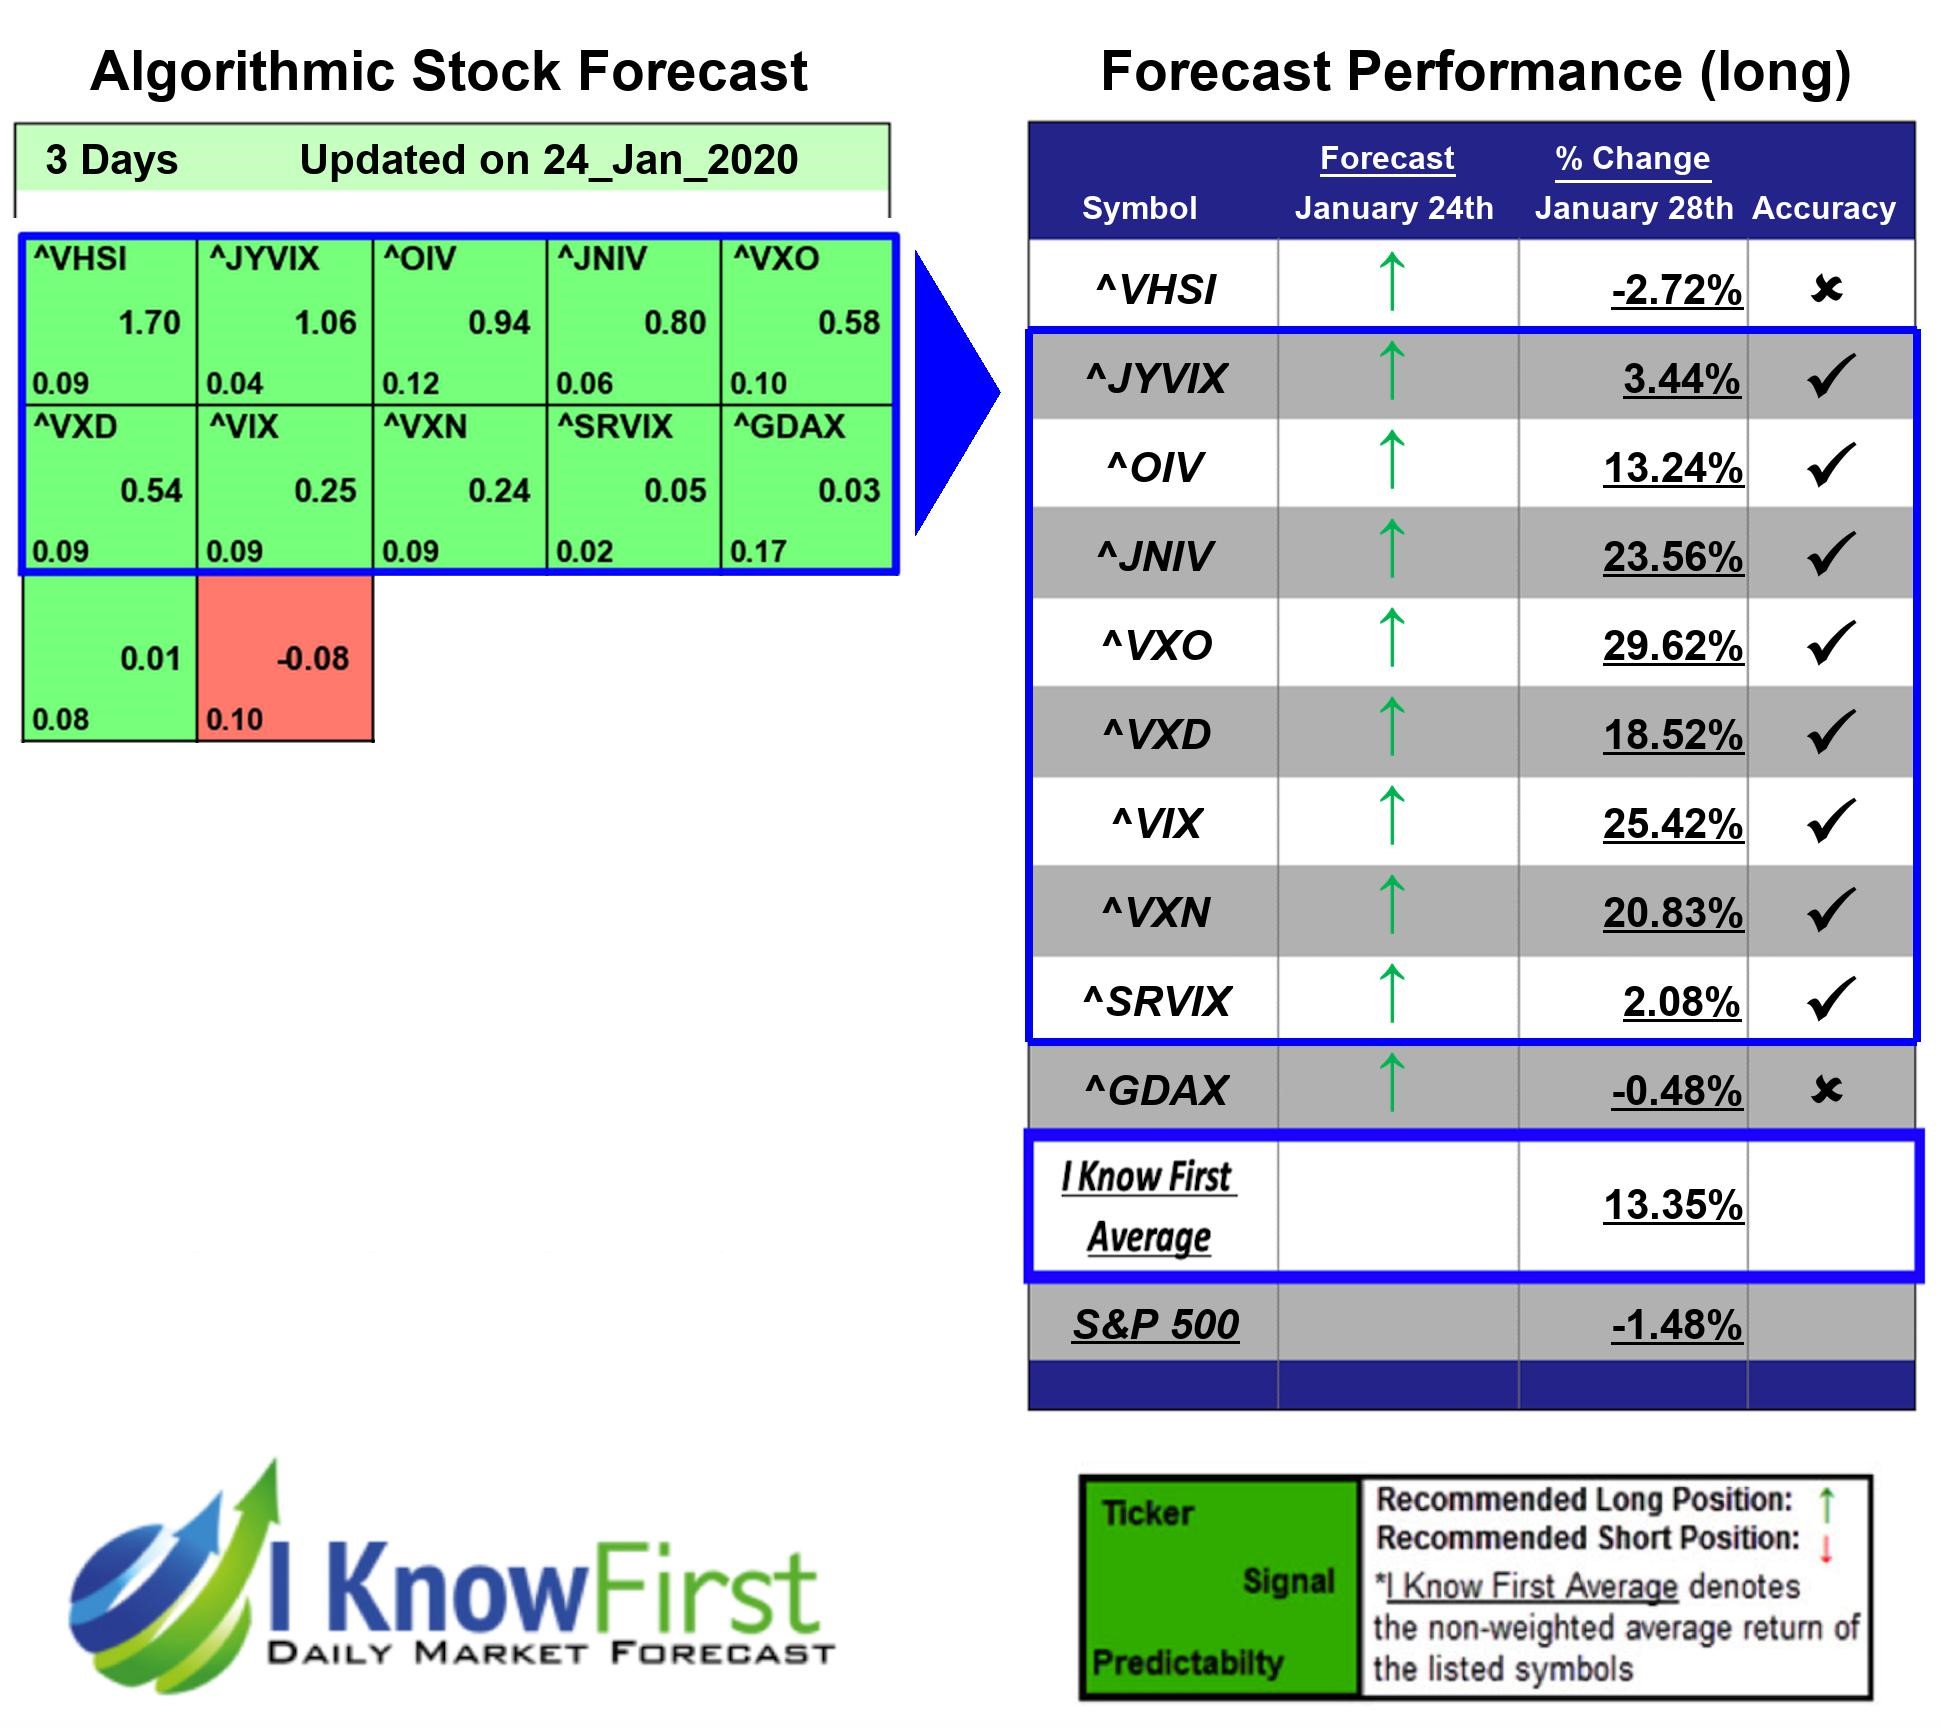
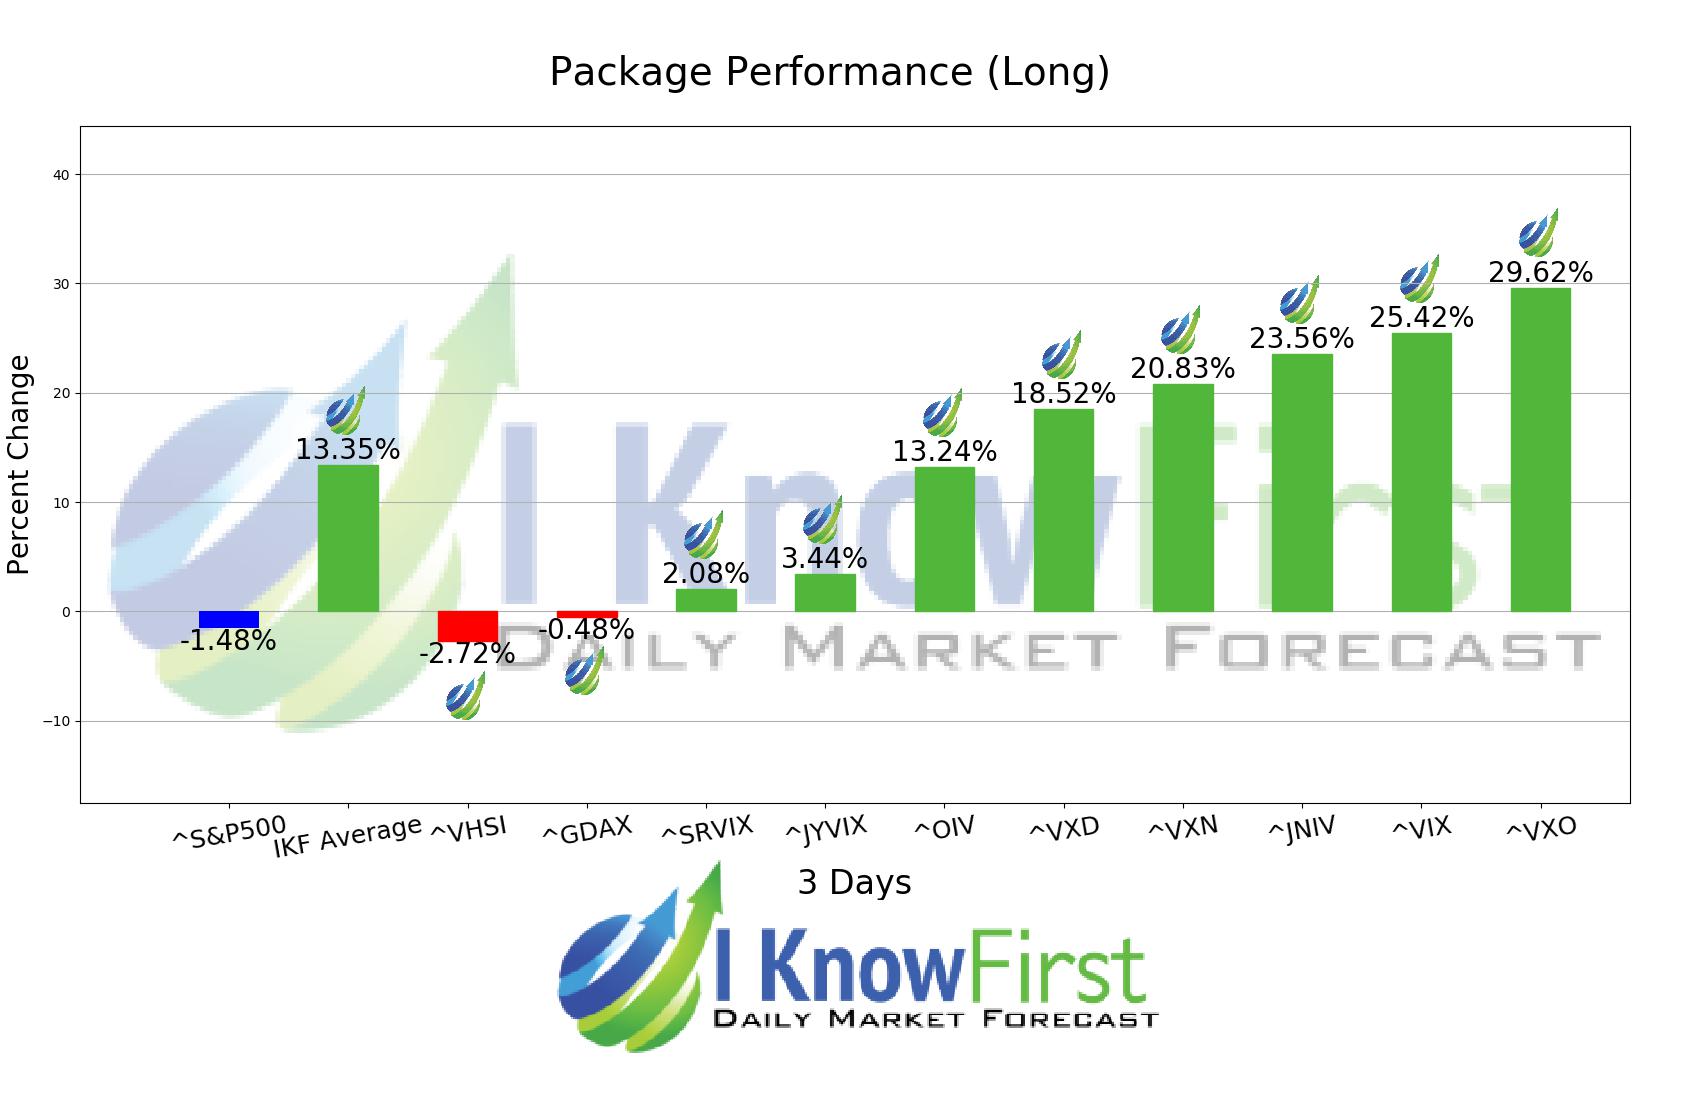
In this 3 Days forecast for the Volatility Forecast Package, there were many high performing trades and the algorithm correctly predicted 8 out 10 trades. The top-performing prediction in this forecast was ^VXO, which registered a return of 29.62%. Further notable returns came from ^VIX and ^JNIV at 25.42% and 23.56%, respectively. The package had an overall average return of 13.35%, providing investors with a premium of 14.83% over the S&P 500’s return of -1.48% during the same period.
The Cboe is continuing to calculate and disseminate the volatility index introduced in 1993 based on trading of S&P 100 (OEX) options. This index has a price history dating back to 1986, which remains the same. As of September 22, 2003, the name was modified — the original-formula index is now known as the Cboe S&P 100 Volatility IndexSM and is now disseminated under the new ticker symbol VXO (prior to September 2003 it was the “original” VIX Index).
Algorithmic traders utilize these daily forecasts by the I Know First market prediction system as a tool to enhance portfolio performance, verify their own analysis and act on market opportunities faster. This forecast was sent to current I Know First subscribers.
How to interpret this diagram
Algorithmic Stock Forecast: The table on the left is a stock forecast produced by I Know First’s algorithm. Each day, subscribers receive forecasts for six different time horizons. Note that the top 10 stocks in the 1-month forecast may be different than those in the 1-year forecast. In the included table, only the relevant stocks have been included. The boxes are arranged according to their respective signal and predictability values (see below for detailed definitions). A green box represents a positive forecast, suggesting a long position, while a red represents a negative forecast, suggesting a short position.
Please note-for trading decisions use the most recent forecast. Get today’s forecast and Top stock picks.


