
Undervalued Stocks Based on Stock Market Algorithm: Returns up to 84.0% in 1 Month
Undervalued Stocks
An insider is legally permitted to buy and sell shares of the firm – and any subsidiaries – that employs him or her. However, these transactions must be properly registered with the Securities and Exchange Commission (SEC) and are done with advance filings. You can find details of this type of insider trading on the SEC’s EDGAR database. This algorithmic forecast is for undervalued stocks with recently reported insiders’ transactions.
An “insider” is any person who possesses at least one of the following:
- access to valuable non-public information about a corporation (for example a company’s directors and high-level executives)
- ownership of more than 10% of the company’s equity

Package Name: Insider Trades
Recommended Positions: Long
Forecast Length: 1 Month (11/20/20 – 12/21/20)
I Know First Average: 21.69%
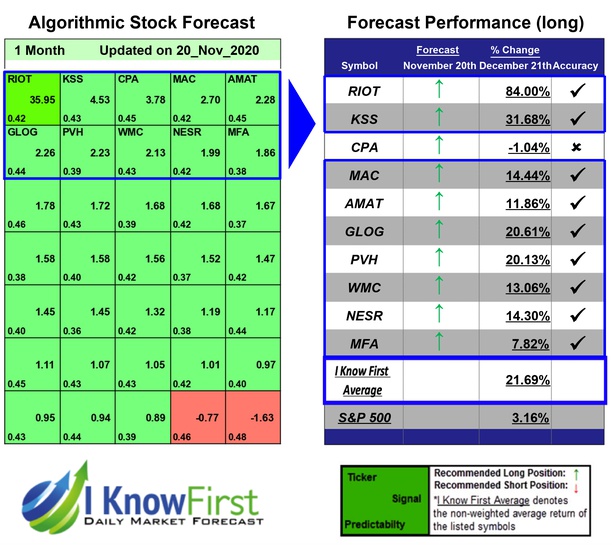
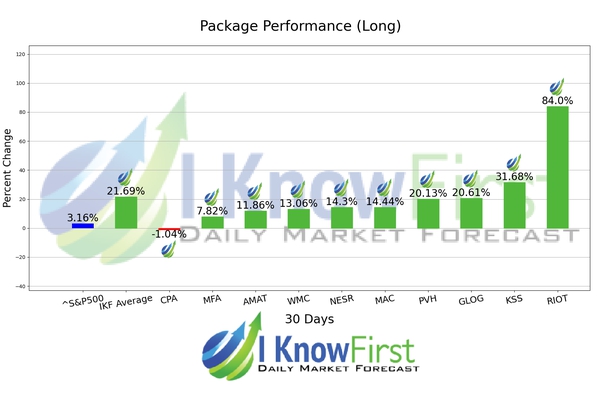
I Know First’s State of the Art Algorithm accurately forecasted 9 out of 10 trades in this Insider Trades Package for the 1 Month time period. RIOT was the top performing prediction with a return of 84.0%. The suggested trades for KSS and GLOG also had notable 1 Month yields of 31.68% and 20.61%, respectively. The package saw an overall yield of 21.69% versus the S&P 500’s return of 3.16% implying a market premium of 18.53%.
Algorithmic traders utilize these daily forecasts by the I Know First market prediction system as a tool to enhance portfolio performance, verify their own analysis and act on market opportunities faster. This forecast was sent to current I Know First subscribers.
How to interpret this diagram
Algorithmic Stock Forecast: The table on the left is a stock forecast produced by I Know First’s algorithm. Each day, subscribers receive forecasts for six different time horizons. Note that the top 10 stocks in the 1-month forecast may be different than those in the 1-year forecast. In the included table, only the relevant stocks have been included. The boxes are arranged according to their respective signal and predictability values (see below for detailed definitions). A green box represents a positive forecast, suggesting a long position, while a red represents a negative forecast, suggesting a short position.
Please note-for trading decisions use the most recent forecast. Get today’s forecast and Top stock picks.


