
Undervalued Stocks Based on Stock Algorithm: Returns up to 13.67% in 7 Days
Undervalued Stocks
The Fundamental Undervalued Stocks Package includes our algorithmic forecasts for stocks screened by fundamental criteria. Our algorithms help you find best opportunities for both long and short positions for the stocks within each fundamental screen. The stocks are selected according to five basic valuation categories:
- P/E (price to earnings ratio)
- PEG (price/earnings to growth ratio)
- price-to-book ratio
- price-to-sales ratio
- short ratio

Package Name: Fundamental – High P/E Stocks
Recommended Positions: Long
Forecast Length: 7 Days (4/11/22 – 4/18/22)
I Know First Average: 3.14%
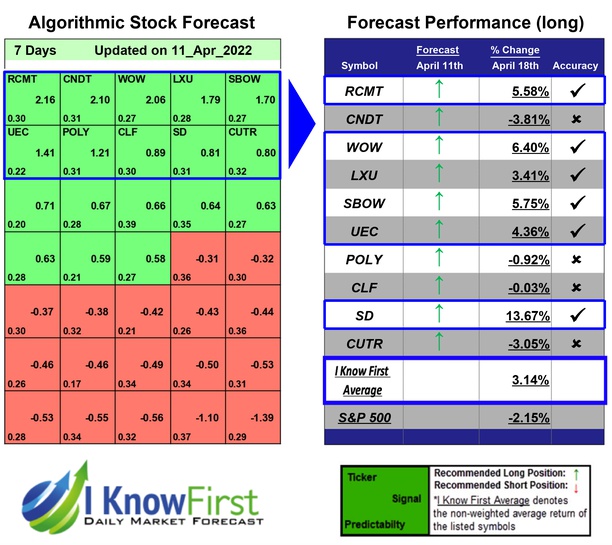

The algorithm correctly predicted 6 out of 10 the suggested trades in the Fundamental – High P/E Stocks Package for this 7 Days forecast. The greatest return came from SD at 13.67%. WOW and SBOW also performed well for this time horizon with returns of 6.4% and 5.75%, respectively. With these notable trade returns, the package itself registered an average return of 3.14% compared to the S&P 500’s return of -2.15% for the same period.
SandRidge Energy, Inc. (SD), an energy company, engages in the exploration, development, and production of crude oil, natural gas, and natural gas liquids primarily in the area of Mid-Continent in Oklahoma and Kansas. The company’s Exploration and Production segment explores for, develops, and produces oil and natural gas properties; and operates wells. Its Midstream Services segment purchases, gathers, treats, and sells natural gas. As of December 31, 2015, it had 4,411 gross producing wells; approximately 2,063,000 gross total acres under lease; and estimated proved reserves were 324.6 million barrels of oil equivalent. The company is headquartered in Oklahoma City, Oklahoma.
Algorithmic traders utilize these daily forecasts by the I Know First market prediction system as a tool to enhance portfolio performance, verify their own analysis and act on market opportunities faster. This forecast was sent to current I Know First subscribers.
How to interpret this diagram
Algorithmic Stock Forecast: The table on the left is a stock forecast produced by I Know First’s algorithm. Each day, subscribers receive forecasts for six different time horizons. Note that the top 10 stocks in the 1-month forecast may be different than those in the 1-year forecast. In the included table, only the relevant stocks have been included. The boxes are arranged according to their respective signal and predictability values (see below for detailed definitions). A green box represents a positive forecast, suggesting a long position, while a red represents a negative forecast, suggesting a short position.
Please note-for trading decisions use the most recent forecast. Get today’s forecast and Top stock picks.


