
Undervalued Stocks Based on Pattern Recognition: Returns up to 50.38% in 14 Days
Undervalued Stocks
The Fundamental Package includes our algorithmic forecasts for undervalued stocks screened by fundamental criteria. Our algorithms help you find best opportunities for both long and short positions for the stocks within each fundamental screen. The stocks are selected according to five basic valuation categories:
- P/E (price to earnings ratio)
- PEG (price/earnings to growth ratio)
- price-to-book ratio
- price-to-sales ratio
- short ratio

Package Name: Fundamental – Low P/E Stocks
Recommended Positions: Long
Forecast Length: 14 Days (11/3/2020 – 11/17/2020)
I Know First Average: 23.61%
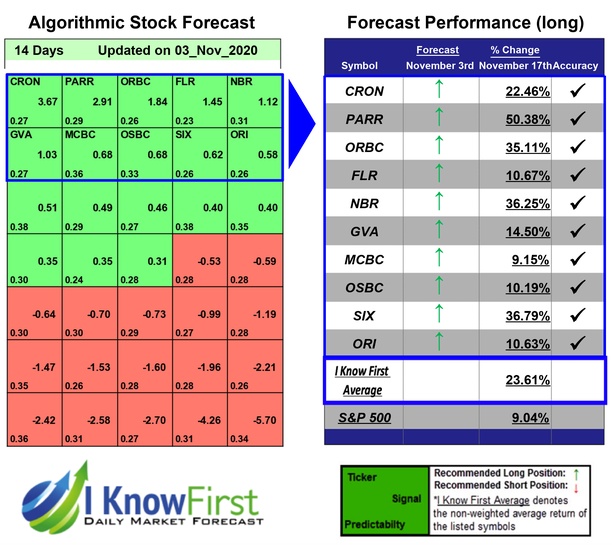

This Fundamental – Low P/E Stocks Package forecast had correctly predicted 10 out of 10 stock movements. The prediction with the highest return was PARR, at 50.38%. SIX, and NBR had notable returns of 36.79% and 36.25%. The package had an overall average return of 23.61%, providing investors with a 14.57% premium over the S&P 500’s return of 9.04% during the period.
Par Pacific Holdings, Inc., incorporated on November 7, 2005, manages and maintains interests in energy and infrastructure businesses. The Company’s segments include Refining, Retail, Logistics, Texadian, and Corporate and Other. Texadian segment focuses on sourcing, marketing, transporting and distributing crude oil and refined products in the United States and Canada. Corporate and Other segment includes several small non-operated oil and gas interests that are owned by the Company’s predecessor.
Algorithmic traders utilize these daily forecasts by the I Know First market prediction system as a tool to enhance portfolio performance, verify their own analysis and act on market opportunities faster. This forecast was sent to current I Know First subscribers.
How to interpret this diagram
Algorithmic Stock Forecast: The table on the left is a stock forecast produced by I Know First’s algorithm. Each day, subscribers receive forecasts for six different time horizons. Note that the top 10 stocks in the 1-month forecast may be different than those in the 1-year forecast. In the included table, only the relevant stocks have been included. The boxes are arranged according to their respective signal and predictability values (see below for detailed definitions). A green box represents a positive forecast, suggesting a long position, while a red represents a negative forecast, suggesting a short position.
Please note-for trading decisions use the most recent forecast. Get today’s forecast and Top stock picks.


