
Top Technology Stocks Based on Big Data Analytics: Returns up to 13.75% in 7 Days
Top Technology Stocks
This Tech Stock forecast is based on stock picking strategies for investors and analysts who need predictions for the 10 best tech stocks in the Technology Industry (see Tech Stocks Package). It includes 20 stocks with bullish and bearish signals:
- Top 10 Tech stocks for the long position
- Top 10 Tech stocks for the short position
Package Name: Tech Stocks Forecast
Recommended Positions: Long
Forecast Length: 7 Days (1/14/21 – 1/21/21)
I Know First Average: 4.95%

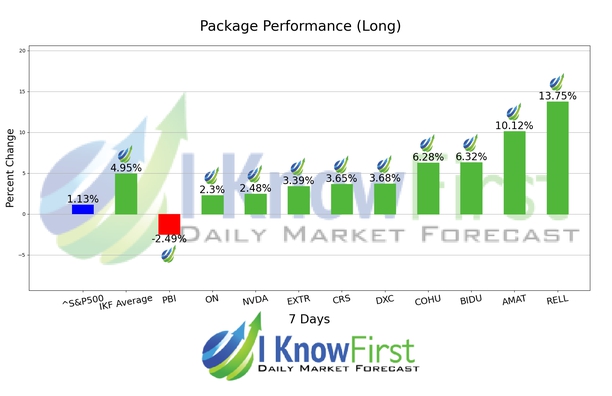
This Tech Stocks Forecast Package forecast had correctly predicted 9 out of 10 stock movements. The highest trade return came from RELL, at 13.75%. The suggested trades for AMAT and BIDU also had notable 7 Days yields of 10.12% and 6.32%, respectively. The Tech Stocks Forecast package had an overall average return of 4.95%, providing investors with a premium of 3.82% over the S&P 500’s return of 1.13%.
Richardson Electronics, Ltd., incorporated on September 11, 1986, is a provider of engineered solutions, power grid and microwave tubes, and related consumables; power conversion, and radio frequency (RF) and microwave components; high value displays, flat panel detector solutions and replacement parts for diagnostic imaging equipment, and customized display solutions. The Company’s segments include Power and Microwave Technologies Group, Canvys and Healthcare. The Company provides design-in support, systems integration, prototype design and manufacturing, testing, logistics, and aftermarket technical service and repair solutions. The Company has operations in North America, Asia/Pacific, Europe and Latin America.
Algorithmic traders utilize these daily forecasts by the I Know First market prediction system as a tool to enhance portfolio performance, verify their own analysis and act on market opportunities faster. This forecast was sent to current I Know First subscribers.
How to interpret this diagram
Algorithmic Stock Forecast: The table on the left is a stock forecast produced by I Know First’s algorithm. Each day, subscribers receive forecasts for six different time horizons. Note that the top 10 stocks in the 1-month forecast may be different than those in the 1-year forecast. In the included table, only the relevant stocks have been included. The boxes are arranged according to their respective signal and predictability values (see below for detailed definitions). A green box represents a positive forecast, suggesting a long position, while a red represents a negative forecast, suggesting a short position.
Please note-for trading decisions use the most recent forecast. Get today’s forecast and Top stock picks.


