
Top Technology Stocks Based on Algo Trading: Returns up to 126.28% in 1 Year
Top Technology Stocks
This Tech Stock forecast is based on stock picking strategies for investors and analysts who need predictions for the 10 best tech stocks in the Technology Industry (see Tech Stocks Package). It includes 20 stocks with bullish and bearish signals:
- Top 10 Tech stocks for the long position
- Top 10 Tech stocks for the short position
Package Name: Tech Stocks Forecast
Recommended Positions: Long
Forecast Length: 1 Year (6/7/20 – 6/7/21)
I Know First Average: 63.11%
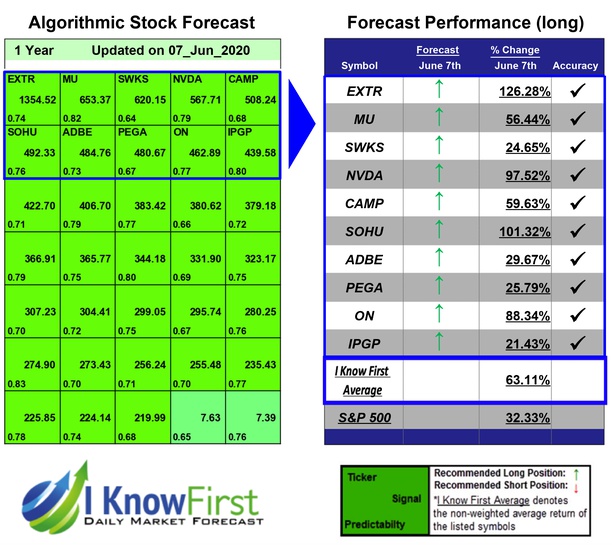
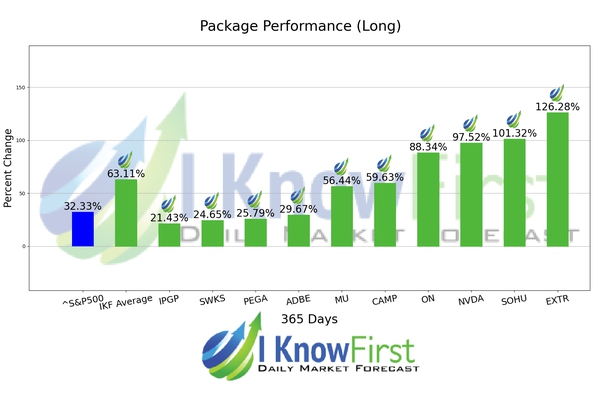
During the 1 Year forecasted period several picks in the Tech Stocks Forecast Package saw significant returns. The algorithm had correctly predicted 10 out 10 returns. The highest trade return came from EXTR, at 126.28%. Additional high returns came from SOHU and NVDA, at 101.32% and 97.52% respectively. The package had an overall average return of 63.11%, providing investors with a 30.78% premium over the S&P 500’s return of 32.33% during the period.
Extreme Networks, Inc. provides software-driven networking solutions for enterprise customers worldwide. The company designs, develops, and manufactures wired and wireless network infrastructure equipment; and develops the software for network management, policy, analytics, security, and access controls.
Algorithmic traders utilize these daily forecasts by the I Know First market prediction system as a tool to enhance portfolio performance, verify their own analysis and act on market opportunities faster. This forecast was sent to current I Know First subscribers.
How to interpret this diagram
Algorithmic Stock Forecast: The table on the left is a stock forecast produced by I Know First’s algorithm. Each day, subscribers receive forecasts for six different time horizons. Note that the top 10 stocks in the 1-month forecast may be different than those in the 1-year forecast. In the included table, only the relevant stocks have been included. The boxes are arranged according to their respective signal and predictability values (see below for detailed definitions). A green box represents a positive forecast, suggesting a long position, while a red represents a negative forecast, suggesting a short position.
Please note-for trading decisions use the most recent forecast. Get today’s forecast and Top stock picks.


