
Top Technology Stock Picks Based on Artificial Intelligence: Returns up to 28.66% in 3 Months
Top Technology Stock Picks
This Top Technology Stock Picks forecast is based on stock picking strategies for investors and analysts who need predictions for the 10 best tech stocks in the Technology Industry (see Tech Stocks Package). It includes 20 stocks with bullish and bearish signals:
- Top 10 Tech stocks for the long position
- Top 10 Tech stocks for the short position

Package Name: Tech Stocks Forecast
Recommended Positions: Long
Forecast Length: 3 Months (11/3/2019 – 2/4/2020)
I Know First Average: 13.13%
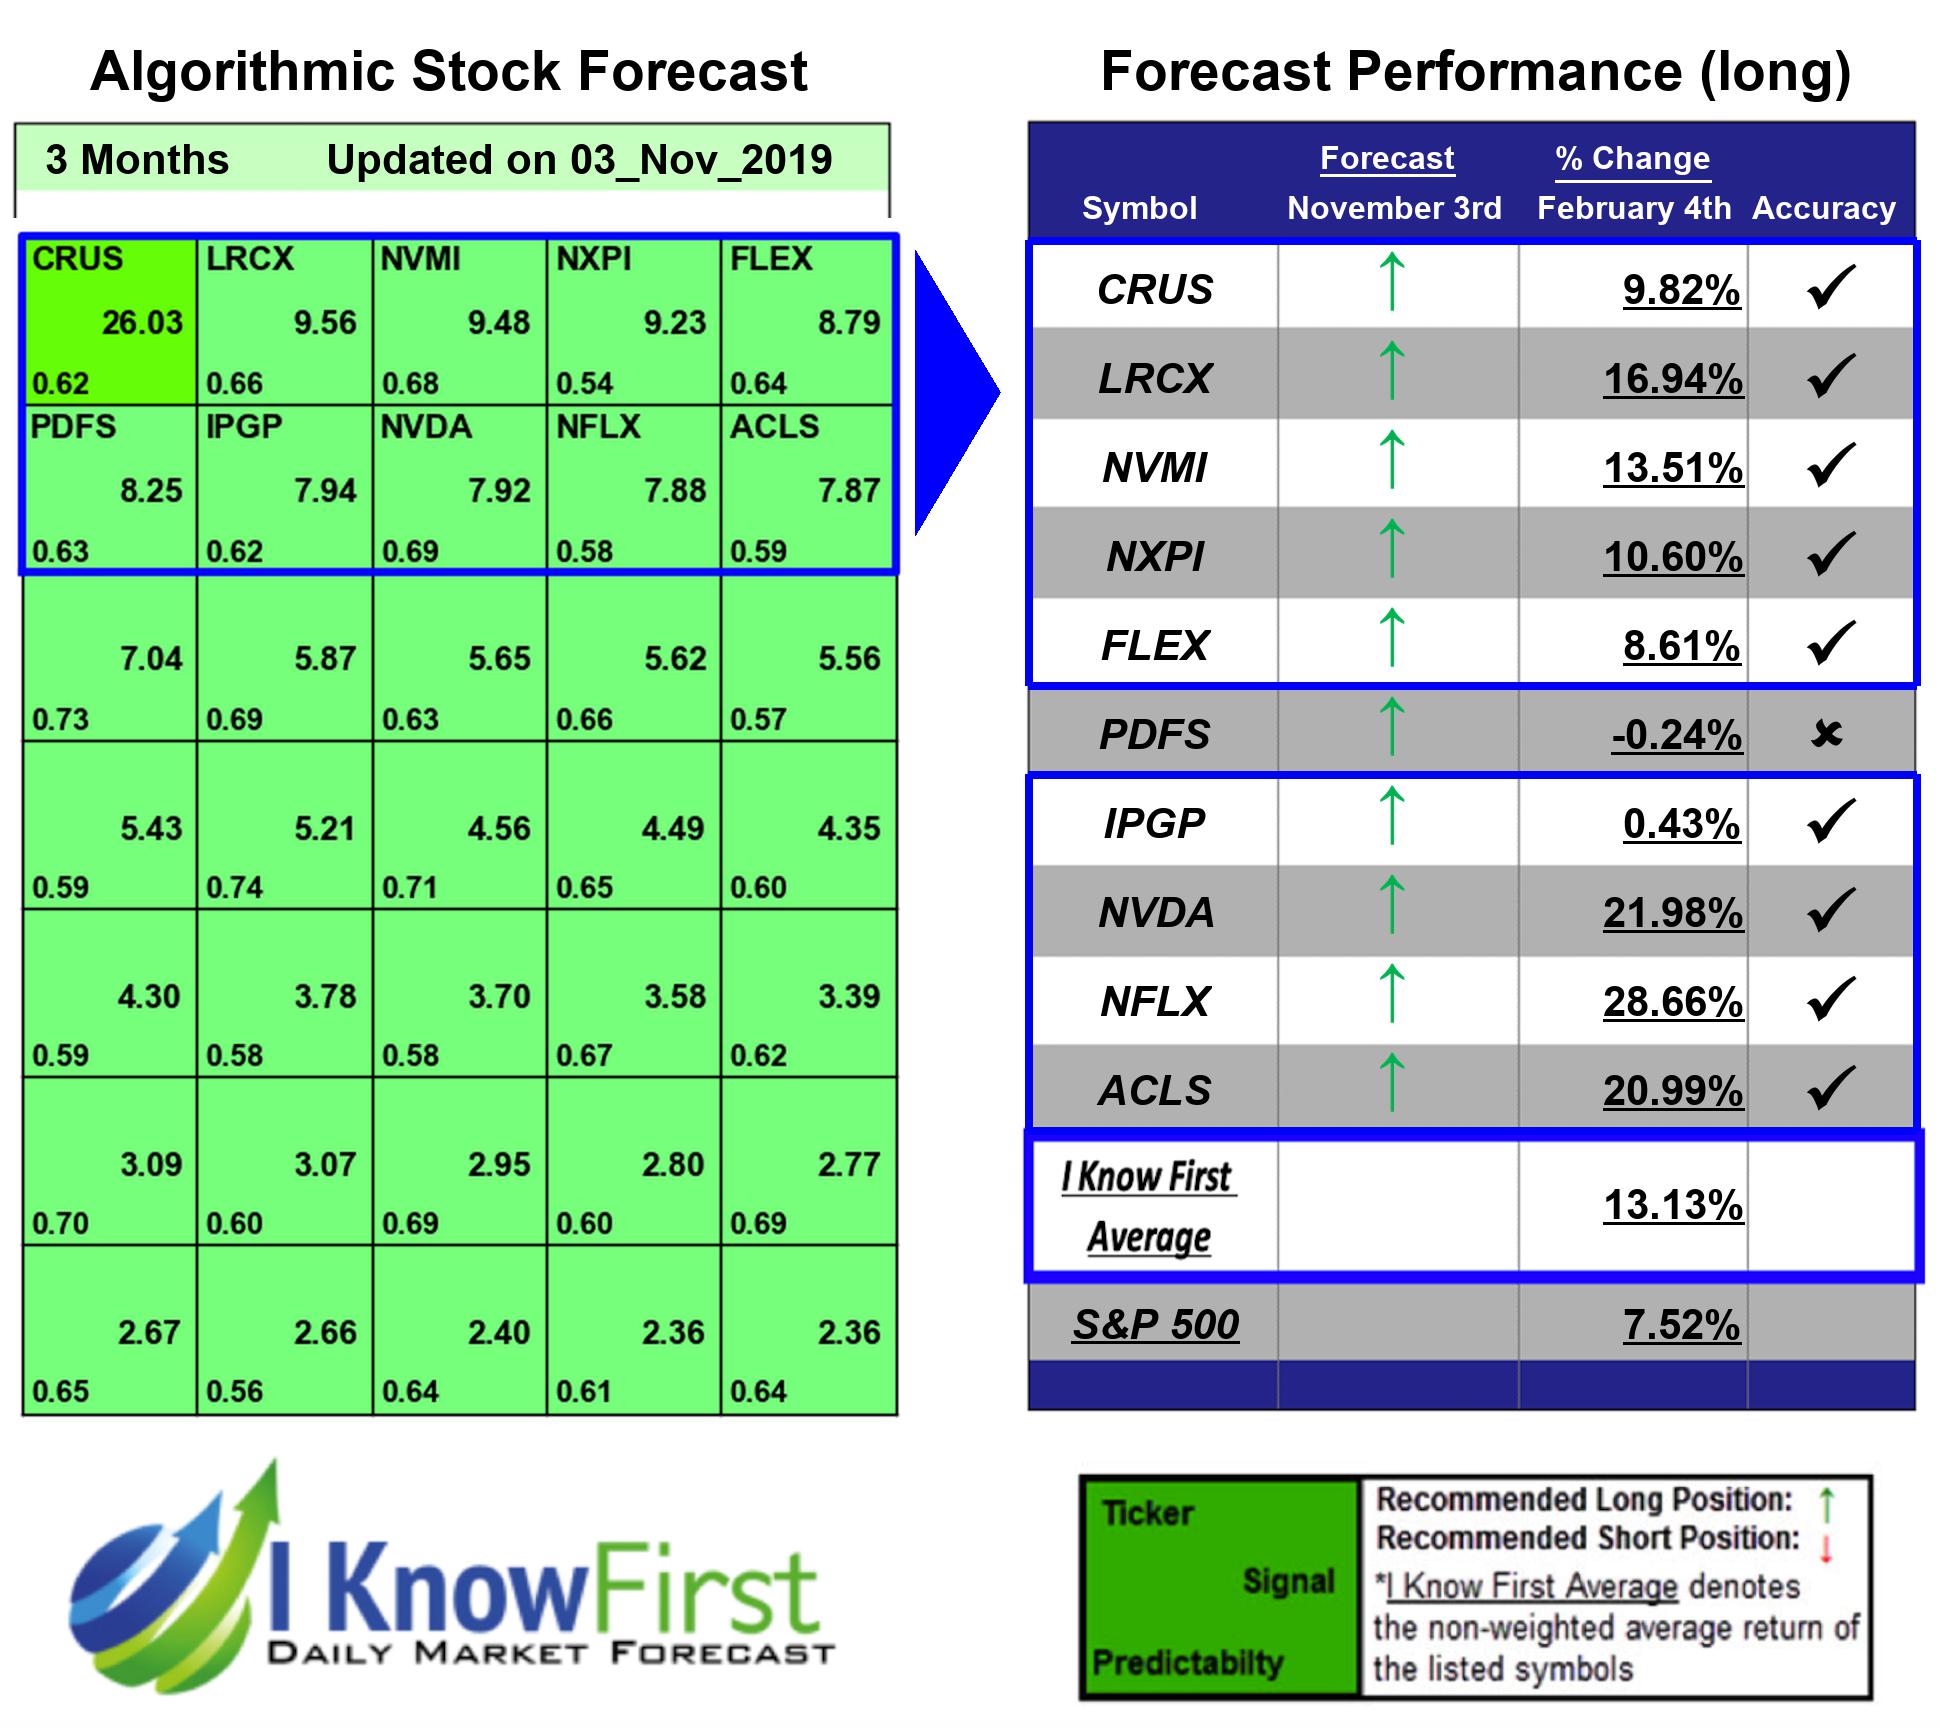
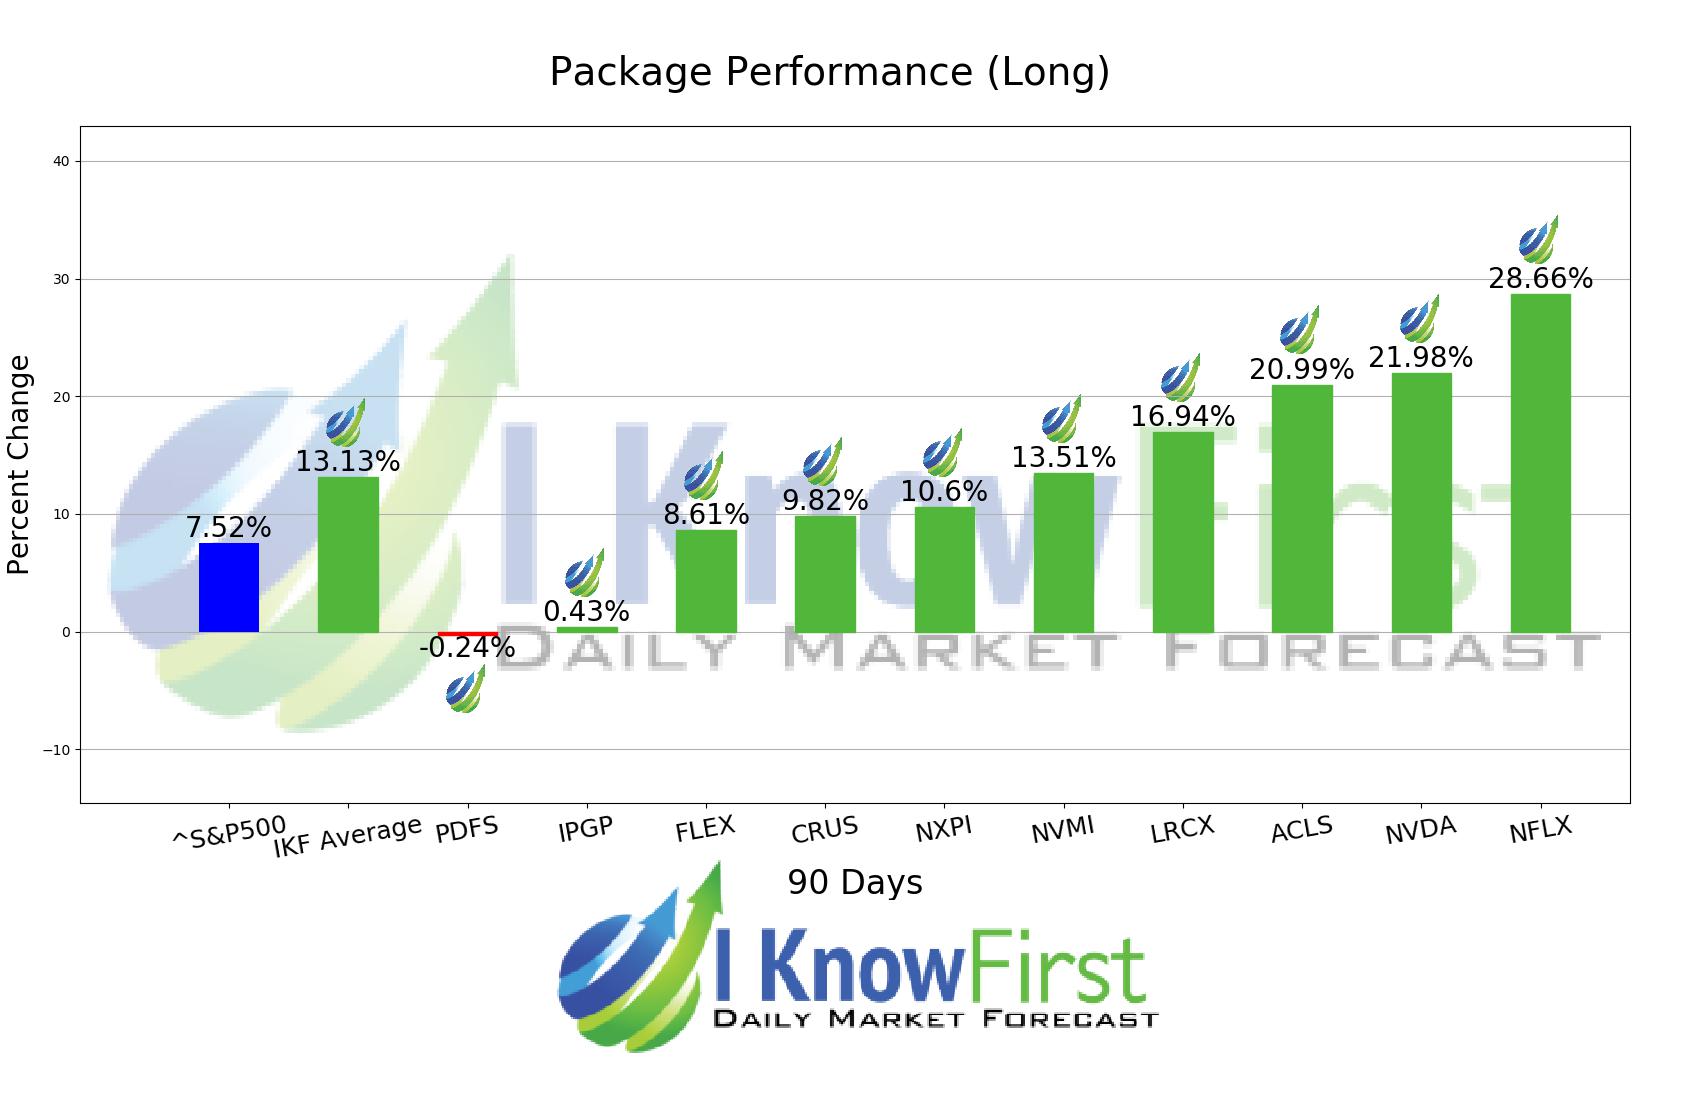
During the 3 Months forecasted period several picks in the Tech Stocks Forecast Package saw significant returns. The algorithm had correctly predicted 9 out 10 returns. The top-performing prediction in this forecast was NFLX, which registered a return of 28.66%. Other notable stocks were NVDA and ACLS with a return of 21.98% and 20.99%. The overall average return in this Tech Stocks Forecast package was 13.13%, providing investors with a 5.61% premium over the S&P 500’s return of 7.52% during the same period.
Netflix Inc. (NFLX) is an Internet subscription service for watching television shows and movies. Subscribers can instantly watch unlimited television shows and movies streamed over the Internet to their televisions, computers, and mobile devices and in the United States, subscribers can receive standard definition DVDs and Blu-ray Discs delivered to their homes.
Algorithmic traders utilize these daily forecasts by the I Know First market prediction system as a tool to enhance portfolio performance, verify their own analysis and act on market opportunities faster. This forecast was sent to current I Know First subscribers.
How to interpret this diagram
Algorithmic Stock Forecast: The table on the left is a stock forecast produced by I Know First’s algorithm. Each day, subscribers receive forecasts for six different time horizons. Note that the top 10 stocks in the 1-month forecast may be different than those in the 1-year forecast. In the included table, only the relevant stocks have been included. The boxes are arranged according to their respective signal and predictability values (see below for detailed definitions). A green box represents a positive forecast, suggesting a long position, while a red represents a negative forecast, suggesting a short position.
Please note-for trading decisions use the most recent forecast. Get today’s forecast and Top stock picks.


