
Top Tech Stocks Based on a Self-learning Algorithm: Returns up to 42.58% in 1 Year
Top Tech Stocks
This Tech Stock forecast is based on stock picking strategies for investors and analysts who need predictions for the 10 best tech stocks in the Technology Industry (see Tech Stocks Package). It includes 20 stocks with bullish and bearish signals:
- Top 10 Tech stocks for the long position
- Top 10 Tech stocks for the short position
Package Name: Tech Stocks Forecast
Recommended Positions: Long
Forecast Length: 1 Year (3/29/2019 – 3/29/2020)
I Know First Average: 11.98%
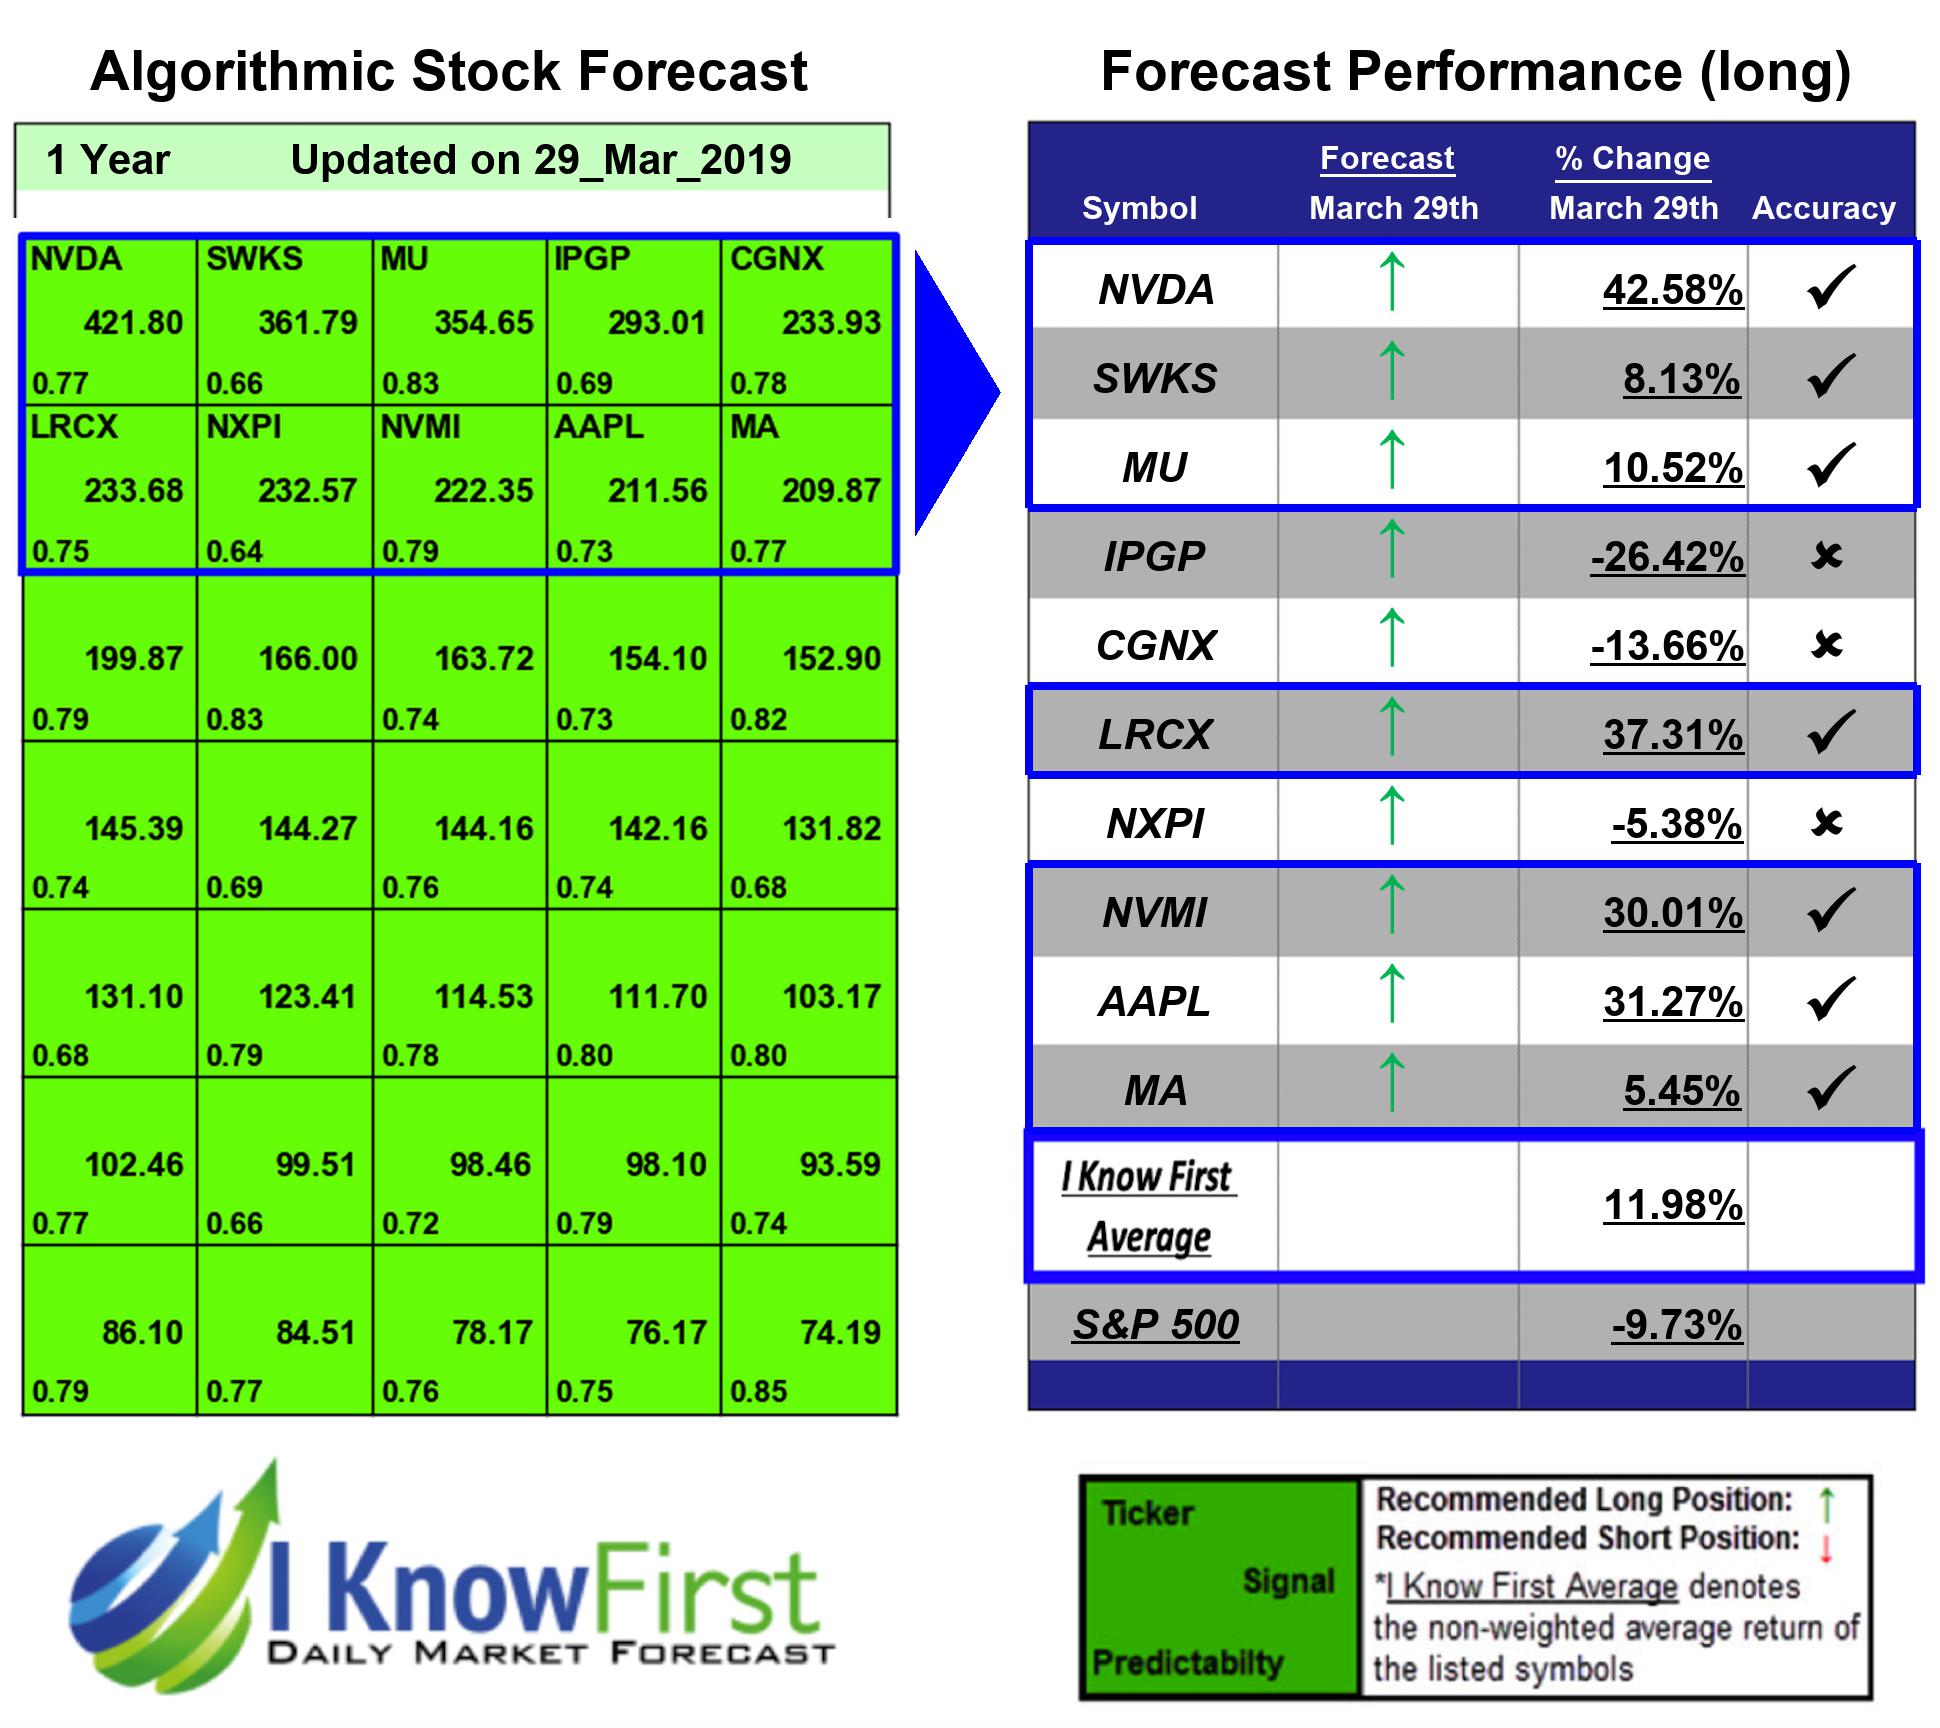
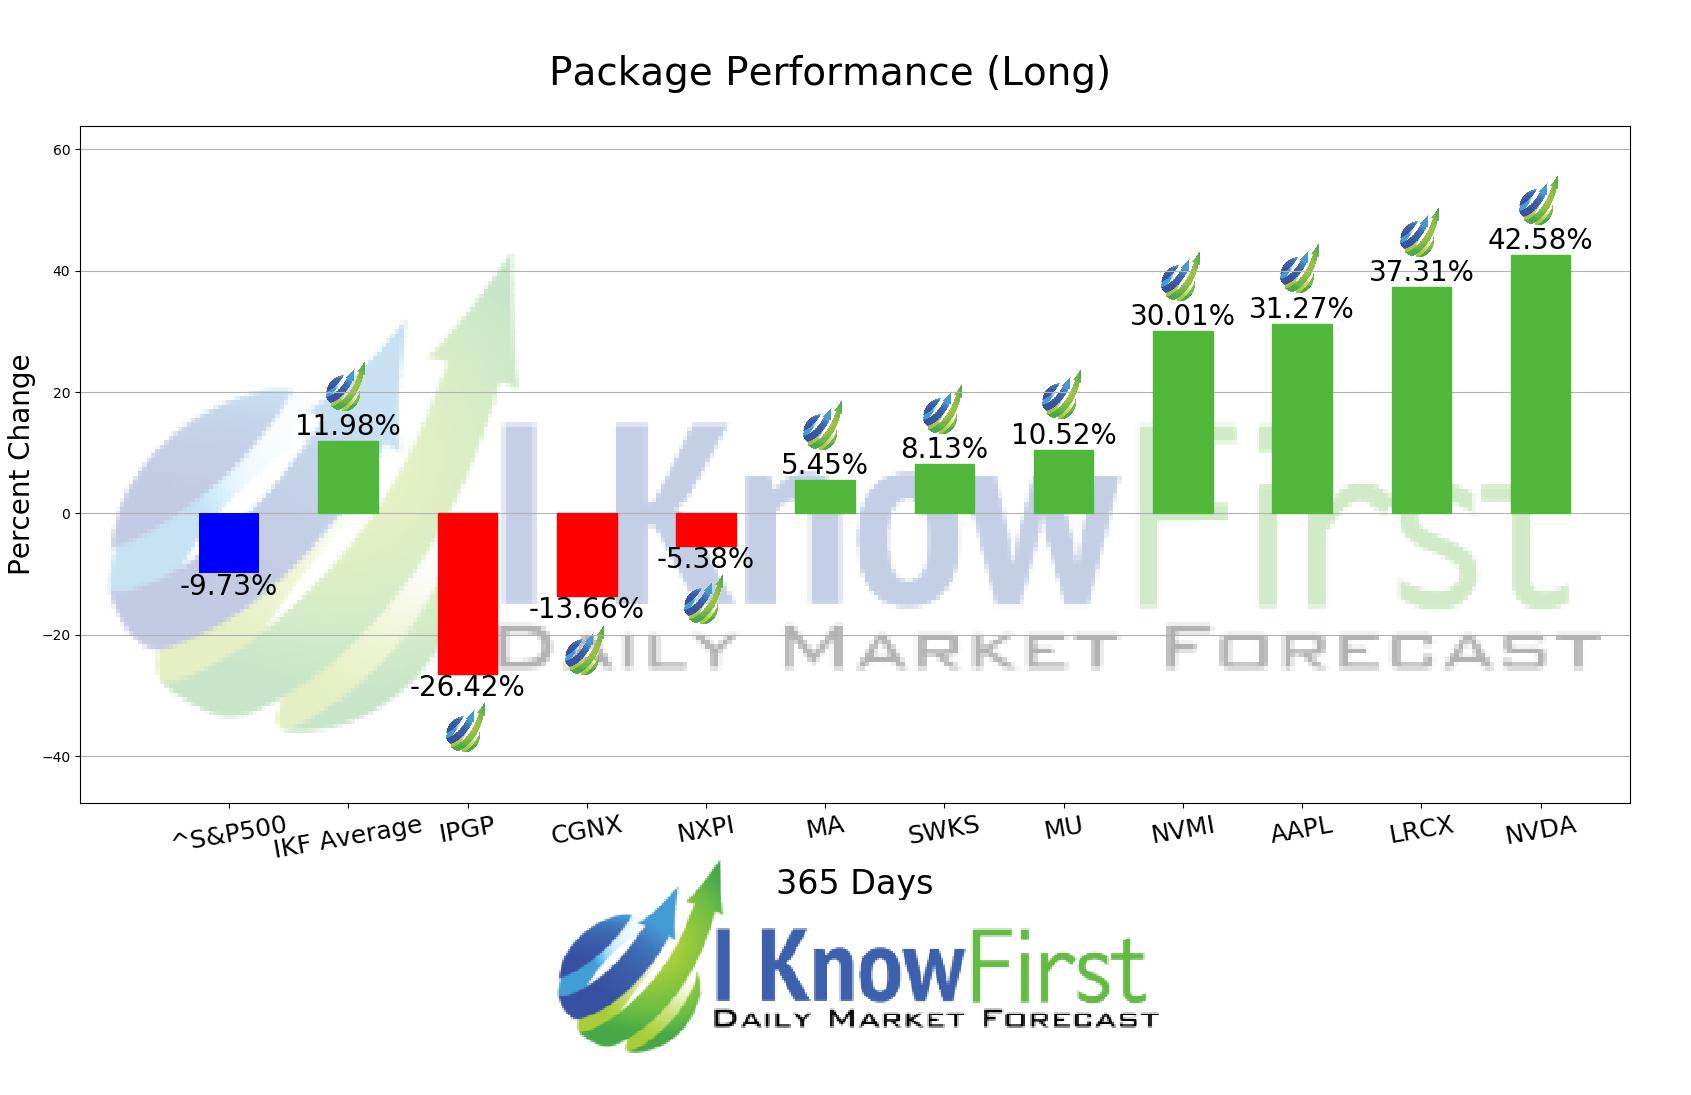
For this 1 Year forecast the algorithm had successfully predicted 7 out of 10 movements. The top performing prediction from this package was NVDA with a return of 42.58%. Additional high returns came from LRCX and AAPL, at 37.31% and 31.27% respectively. The Tech Stocks Forecast package had an overall average return of 11.98%, providing investors with a premium of 21.71% over the S&P 500’s return of -9.73%.
NVIDIA Corporation (NVDA) is as a visual computing company worldwide. It operates in two segments, GPU and Tegra Processor. The GPU segment offers processors, which include GeForce for PC gaming; Quadro for design professionals working in computer-aided design, video editing, special effects, and other creative applications
Algorithmic traders utilize these daily forecasts by the I Know First market prediction system as a tool to enhance portfolio performance, verify their own analysis and act on market opportunities faster. This forecast was sent to current I Know First subscribers.
How to interpret this diagram
Algorithmic Stock Forecast: The table on the left is a stock forecast produced by I Know First’s algorithm. Each day, subscribers receive forecasts for six different time horizons. Note that the top 10 stocks in the 1-month forecast may be different than those in the 1-year forecast. In the included table, only the relevant stocks have been included. The boxes are arranged according to their respective signal and predictability values (see below for detailed definitions). A green box represents a positive forecast, suggesting a long position, while a red represents a negative forecast, suggesting a short position.
Please note-for trading decisions use the most recent forecast. Get today’s forecast and Top stock picks.


