
Top Stocks Under 5 Based on Genetic Algorithms: Returns up to 6.31% in 3 Days
Top Stocks Under 5
This stock forecast is part of the Stocks Under 5 Dollars Package, as one of I Know First’s algorithmic trading tools. The full package includes daily predictions for a total of 20 Top Stocks Under 5 stocks with bullish and bearish signals:
- Top 10 stocks for the long position
- Top 10 stocks for the short position
![]()
![]()
Package Name: Stocks Under $5
Recommended Positions: Long
Forecast Length: 3 Days (8/28/2020 – 8/31/2020)
I Know First Average: 0.87%
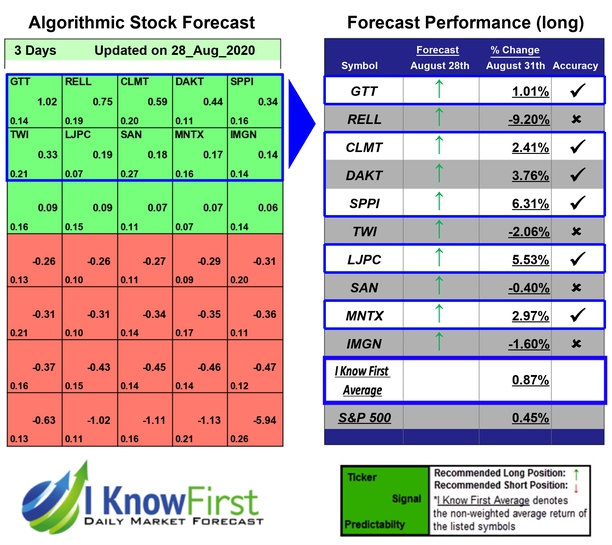
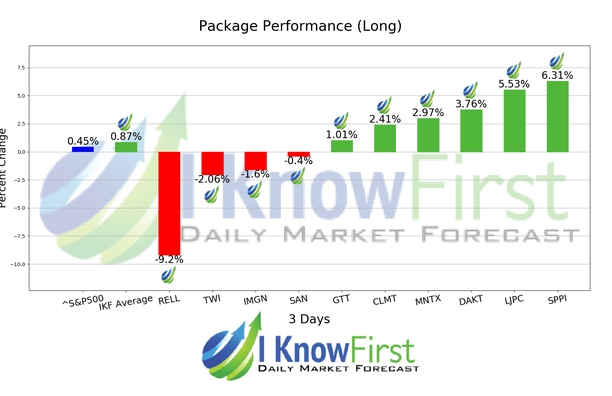
The algorithm correctly predicted 6 out 10 of the suggested trades in the Stocks Under $5 Package for this 3 Days forecast. The top-performing prediction in this forecast was SPPI, which registered a return of 6.31%. Additional high returns came from LJPC and DAKT, at 5.53% and 3.76% respectively. The package had an overall average return of 0.87%, providing investors with a premium of 0.42% over the S&P 500’s return of 0.45% during the same period.
Spectrum Pharmaceuticals, Inc. is a biotechnology company with fully integrated commercial and drug development operations with a primary focus in oncology. The Company’s strategy is comprised of acquiring, developing, and commercializing a broad and diverse pipeline of late-stage clinical and commercial products.
Algorithmic traders utilize these daily forecasts by the I Know First market prediction system as a tool to enhance portfolio performance, verify their own analysis and act on market opportunities faster. This forecast was sent to current I Know First subscribers.
How to interpret this diagram
Algorithmic Stock Forecast: The table on the left is a stock forecast produced by I Know First’s algorithm. Each day, subscribers receive forecasts for six different time horizons. Note that the top 10 stocks in the 1-month forecast may be different than those in the 1-year forecast. In the included table, only the relevant stocks have been included. The boxes are arranged according to their respective signal and predictability values (see below for detailed definitions). A green box represents a positive forecast, suggesting a long position, while a red represents a negative forecast, suggesting a short position.
Please note-for trading decisions use the most recent forecast. Get today’s forecast and Top stock picks.


