
Top Stocks Based on Big Data: Returns up to 17.76% in 7 Days
Top Stocks
This forecast is part of the Top 10 Stocks Package, as one of I Know First’s systematic trading tools. The full package includes a daily prediction for a total of 20 stocks with bullish and bearish signals:
- Top 10 stocks pick for the long position
- Top 10 stocks pick for the short position
![]()
![]()
Package Name: Stock Forecast & S&P500 Forecast
Recommended Positions: Long
Forecast Length: 7 Days (7/15/2020 – 7/22/2020)
I Know First Average: 4.61%
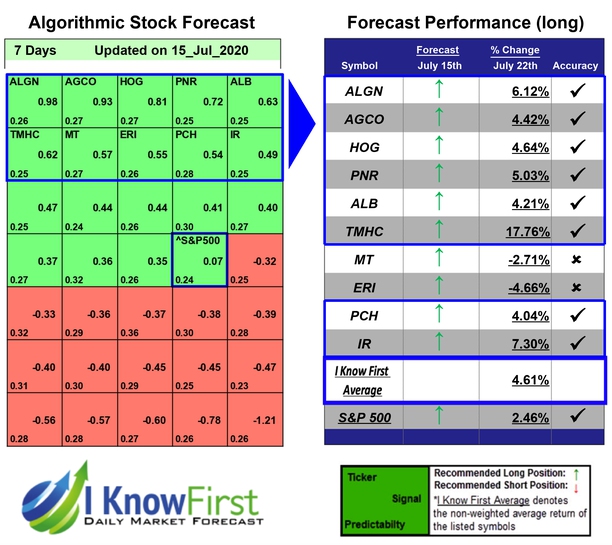
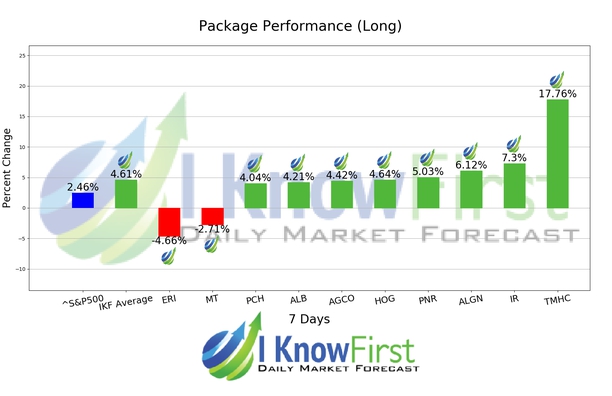
The algorithm correctly predicted 8 out 10 of the suggested trades in the Stock Forecast & S&P500 Forecast Package for this 7 Days forecast. The top performing prediction from this package was TMHC with a return of 17.76%. IR and ALGN saw outstanding returns of 7.3% and 6.12%. This algorithmic forecast package presented an overall return of 4.61% versus S&P 500’s performance of 2.46% providing a market premium of 2.15%.
Taylor Morrison Home Corporation (TMHC) operates as a public homebuilder in the United States. The company builds single-family detached and attached homes; and develops lifestyle and master planned communities. It operates under the Taylor Morrison and Darling Homes brands in Florida, Georgia, Carolina, Texas, Arizona, California, Colorado, and Illinois. The company also offers mortgage and title services. Taylor Morrison Home Corporation (TMHC) was founded in 1936 and is headquartered in Scottsdale, Arizona.
Algorithmic traders utilize these daily forecasts by the I Know First market prediction system as a tool to enhance portfolio performance, verify their own analysis and act on market opportunities faster. This forecast was sent to current I Know First subscribers.
How to interpret this diagram
Algorithmic Stock Forecast: The table on the left is a stock forecast produced by I Know First’s algorithm. Each day, subscribers receive forecasts for six different time horizons. Note that the top 10 stocks in the 1-month forecast may be different than those in the 1-year forecast. In the included table, only the relevant stocks have been included. The boxes are arranged according to their respective signal and predictability values (see below for detailed definitions). A green box represents a positive forecast, suggesting a long position, while a red represents a negative forecast, suggesting a short position.
Please note-for trading decisions use the most recent forecast. Get today’s forecast and Top stock picks.


