
Top Stock Picks Based on Pattern Recognition: Returns up to 205.27% in 1 Year
Top Stock Picks
This forecast is part of the Top 10 Stocks Package, as one of I Know First’s systematic trading tools. The full package includes a daily prediction for a total of 20 top stock picks with bullish and bearish signals:
- Top 10 stocks pick for the long position
- Top 10 stocks pick for the short position
![]()
![]()
Package Name: Stock Forecast & S&P500 Forecast
Recommended Positions: Long
Forecast Length: 1 Year (5/10/20 – 5/10/21)
I Know First Average: 91.18%

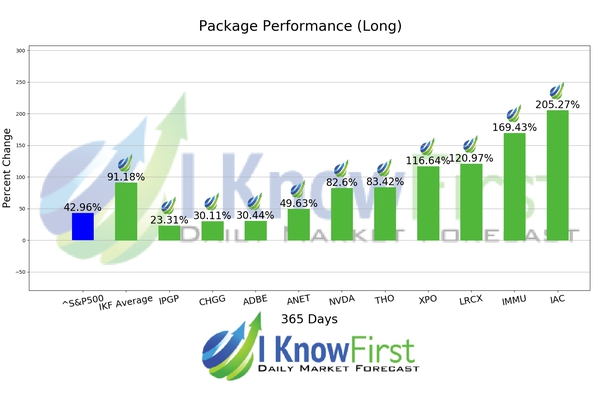
Several predictions in this 1 Year forecast saw significant returns. The algorithm had correctly predicted 10 out 10 stock movements. The top-performing prediction in this forecast was IAC, which registered a return of 205.27%. Other notable stocks were IMMU and LRCX with a return of 169.43% and 120.97%. The overall average return in this Stock Forecast & S&P500 Forecast package was 91.18%, providing investors with a 48.22% premium over the S&P 500’s return of 42.96% during the same period.
IAC/InterActiveCorp, together with its subsidiaries, operates as a media and Internet company in the United States and internationally. It operates through six segments: Match Group, HomeAdvisor, Video, Applications, Publishing, and Other.
Algorithmic traders utilize these daily forecasts by the I Know First market prediction system as a tool to enhance portfolio performance, verify their own analysis and act on market opportunities faster. This forecast was sent to current I Know First subscribers.
How to interpret this diagram
Algorithmic Stock Forecast: The table on the left is a stock forecast produced by I Know First’s algorithm. Each day, subscribers receive forecasts for six different time horizons. Note that the top 10 stocks in the 1-month forecast may be different than those in the 1-year forecast. In the included table, only the relevant stocks have been included. The boxes are arranged according to their respective signal and predictability values (see below for detailed definitions). A green box represents a positive forecast, suggesting a long position, while a red represents a negative forecast, suggesting a short position.
Please note-for trading decisions use the most recent forecast. Get today’s forecast and Top stock picks.


