
Top Stock Picks Based on Data Mining: Returns up to 11.12% in 7 Days
Top Stock Picks
This S&P 100 stocks forecast is designed for investors and analysts who need predictions for the best large cap performing stocks in the S&P100 Company Package (see S&P100 Stocks Package). It includes 20 stocks with bullish and bearish signals and indicates the best S&P100 Companies stocks to buy:
- Top 10 S&P100 stocks for the long position
- Top 10 S&P100 stocks for the short position

Package Name: S&P 100 Stocks
Recommended Positions: Long
Forecast Length: 7 Days (10/1/21 – 10/9/21)
I Know First Average: 4.71%
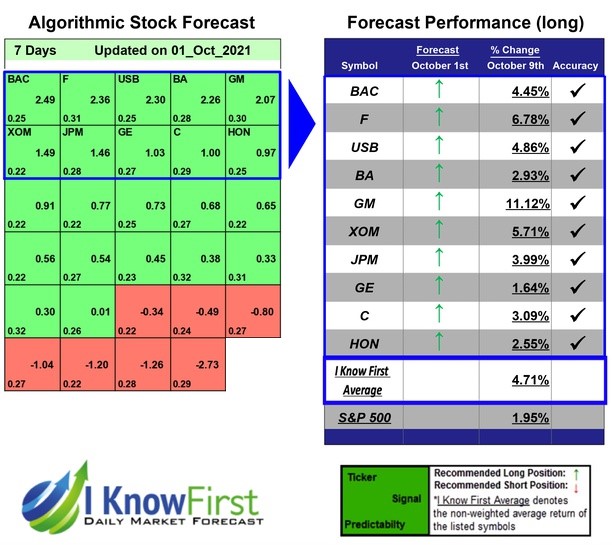
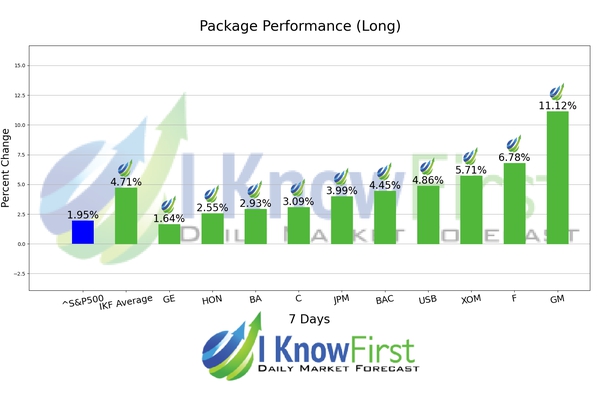
Several predictions in this 7 Days forecast saw significant returns. The algorithm had correctly predicted 10 out of 10 stock movements. The top performing prediction from this package was GM with a return of 11.12%. Additional high returns came from F and XOM, at 6.78% and 5.71% respectively. The package’s overall average return was 4.71%, providing investors with a 2.76% premium over the S&P 500’s return of 1.95% during the same period.
General Motors Company (GM) designs, builds, and sells cars, crossovers, trucks, and automobile parts worldwide. The company operates through GM North America, GM Europe, GM International Operations, GM South America, and GM Financial segments. It markets its vehicles primarily under the Buick, Cadillac, Chevrolet, GMC, Opel, Holden, Vauxhall, Baojun, Jiefang, and Wuling brand names. The company also sells cars and trucks to dealers for consumer retail sales, as well as to fleet customers, including daily rental car companies, commercial fleet customers, leasing companies, and governments. In addition, it offers connected safety, security and mobility solutions, and information technology services. The company, through its subsidiary, General Motors Financial Company, Inc., provides automotive financing services. General Motors Company (GM) was founded in 1897 and is based in Detroit, Michigan.
Algorithmic traders utilize these daily forecasts by the I Know First market prediction system as a tool to enhance portfolio performance, verify their own analysis and act on market opportunities faster. This forecast was sent to current I Know First subscribers.
How to interpret this diagram
Algorithmic Stock Forecast: The table on the left is a stock forecast produced by I Know First’s algorithm. Each day, subscribers receive forecasts for six different time horizons. Note that the top 10 stocks in the 1-month forecast may be different than those in the 1-year forecast. In the included table, only the relevant stocks have been included. The boxes are arranged according to their respective signal and predictability values (see below for detailed definitions). A green box represents a positive forecast, suggesting a long position, while a red represents a negative forecast, suggesting a short position.
Please note-for trading decisions use the most recent forecast. Get today’s forecast and Top stock picks.


