
Top Stock Picks Based on Big Data: Returns up to 91.3% in 1 Year
Top Stock Picks
This S&P 100 stocks forecast is designed for investors and analysts who need predictions for the best large cap performing stocks in the S&P100 Company Package (see S&P100 Stocks Package). It includes 20 stocks with bullish and bearish signals and indicates the best S&P100 Companies stocks to buy:
- Top 10 S&P100 stocks for the long position
- Top 10 S&P100 stocks for the short position

Package Name: S&P 100 Stocks
Recommended Positions: Long
Forecast Length: 1 Year (7/19/2019 – 7/20/2020)
I Know First Average: 16.53%

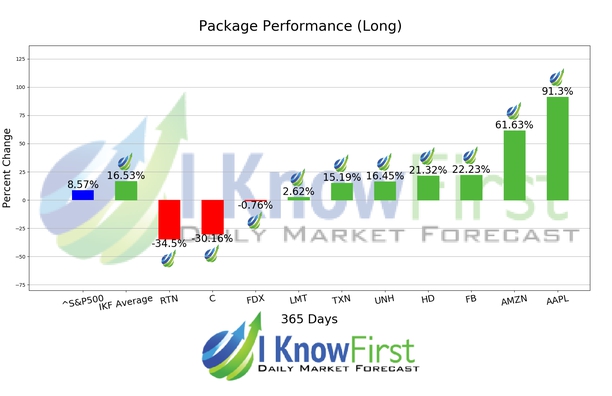
In this 1 Year forecast for the S&P 100 Stocks Package, there were many high performing trades and the algorithm correctly predicted 7 out 10 trades. The greatest return came from AAPL at 91.3%. AMZN and FB saw outstanding returns of 61.63% and 22.23%. The package itself saw an overall return of 16.53%, providing investors with a 7.96% premium above the S&P 500’s return of 8.57% for the same time period.
Apple Inc., incorporated on January 3, 1977, designs, manufactures and markets mobile communication and media devices, personal computers and portable digital music players. The Company sells a range of related software, services, accessories, networking solutions and third-party digital content and applications. The Company’s segments include the Americas, Europe, Greater China, Japan and Rest of Asia Pacific. The Americas segment includes both North and South America. The Europe segment includes European countries, India, the Middle East and Africa. The Greater China segment includes China, Hong Kong and Taiwan. The Rest of Asia Pacific segment includes Australia and the Asian countries not included in the Company’s other operating segments. The Company’s products and services include iPhone, iPad, Mac, iPod, Apple Watch, Apple TV, a portfolio of consumer and professional software applications, iPhone OS (iOS), OS X and watchOS operating systems, iCloud, Apple Pay and a range of accessory, service and support offerings.
Algorithmic traders utilize these daily forecasts by the I Know First market prediction system as a tool to enhance portfolio performance, verify their own analysis and act on market opportunities faster. This forecast was sent to current I Know First subscribers.
How to interpret this diagram
Algorithmic Stock Forecast: The table on the left is a stock forecast produced by I Know First’s algorithm. Each day, subscribers receive forecasts for six different time horizons. Note that the top 10 stocks in the 1-month forecast may be different than those in the 1-year forecast. In the included table, only the relevant stocks have been included. The boxes are arranged according to their respective signal and predictability values (see below for detailed definitions). A green box represents a positive forecast, suggesting a long position, while a red represents a negative forecast, suggesting a short position.
Please note-for trading decisions use the most recent forecast. Get today’s forecast and Top stock picks.


