
Top S&P 500 Stocks Based on Predictive Analytics: Returns up to 39.25% in 1 Month
Top S&P 500 Stocks
This top S&P 500 stocks forecast is designed for investors and analysts who need predictions for the whole S&P 500 (See S&P 500 Companies Package). It includes 20 stocks with bullish and bearish signals and indicates the best S&P 500 Companies stocks to buy:
- Top 10 S&P 500 stocks for the long position
- Top 10 S&P 500 stocks for the short position

Package Name: Top S&P 500 Stocks
Recommended Positions: Long
Forecast Length: 1 Month (2/10/21 – 3/10/21)
I Know First Average: 14.05%
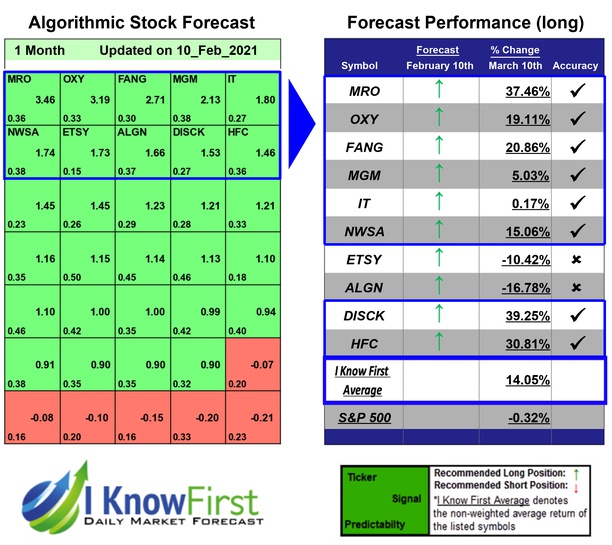
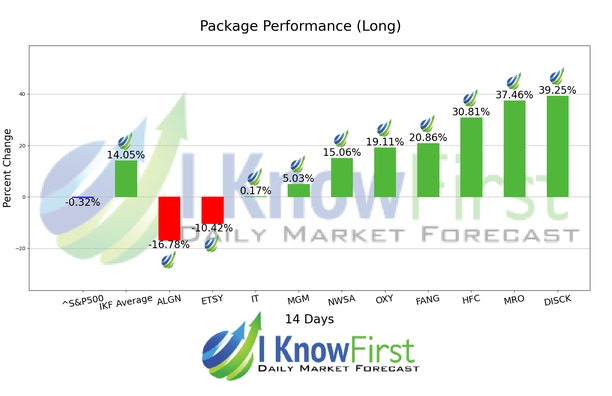
In this 1 Month forecast for the package, there were many high performing trades and the algorithm correctly predicted 8 out 10 trades. DISCK was the top performing prediction with a return of 39.25%. Additional high returns came from MRO and HFC, at 37.46% and 30.81% respectively. The package had an overall average return of 14.05%, providing investors with a premium of 14.37% over the S&P 500’s return of -0.32% during the same period.
Discovery Communications, Inc. operates as a media company worldwide. The company operates through U.S. Networks, International Networks, and Education and Other segments. It owns and operates various television networks under the Discovery Channel, TLC, Animal Planet, Investigation Discovery, Science Channel, Velocity, Discovery Family, American Heroes Channel, Destination America, Discovery Life, Oprah Winfrey Network, Eurosport, DMAX, and Discovery Kids brands, as well as other regional television networks.
Algorithmic traders utilize these daily forecasts by the I Know First market prediction system as a tool to enhance portfolio performance, verify their own analysis and act on market opportunities faster. This forecast was sent to current I Know First subscribers.
How to interpret this diagram
Algorithmic Stock Forecast: The table on the left is a stock forecast produced by I Know First’s algorithm. Each day, subscribers receive forecasts for six different time horizons. Note that the top 10 stocks in the 1-month forecast may be different than those in the 1-year forecast. In the included table, only the relevant stocks have been included. The boxes are arranged according to their respective signal and predictability values (see below for detailed definitions). A green box represents a positive forecast, suggesting a long position, while a red represents a negative forecast, suggesting a short position.
Please note-for trading decisions use the most recent forecast. Get today’s forecast and Top stock picks.


