
Top S&P 500 Stocks Based on Deep-Learning: Returns up to 10.68% in 3 Days
Top S&P 500 Stocks
This top S&P 500 stocks forecast is designed for investors and analysts who need predictions for the whole S&P 500 (See S&P 500 Companies Package). It includes 20 stocks with bullish and bearish signals and indicates the best S&P 500 Companies stocks to buy:
- Top 10 S&P 500 stocks for the long position
- Top 10 S&P 500 stocks for the short position

Package Name: Top S&P 500 Stocks
Recommended Positions: Long
Forecast Length: 3 Days (3/4/2020 – 3/7/2020)
I Know First Average: 2.81%

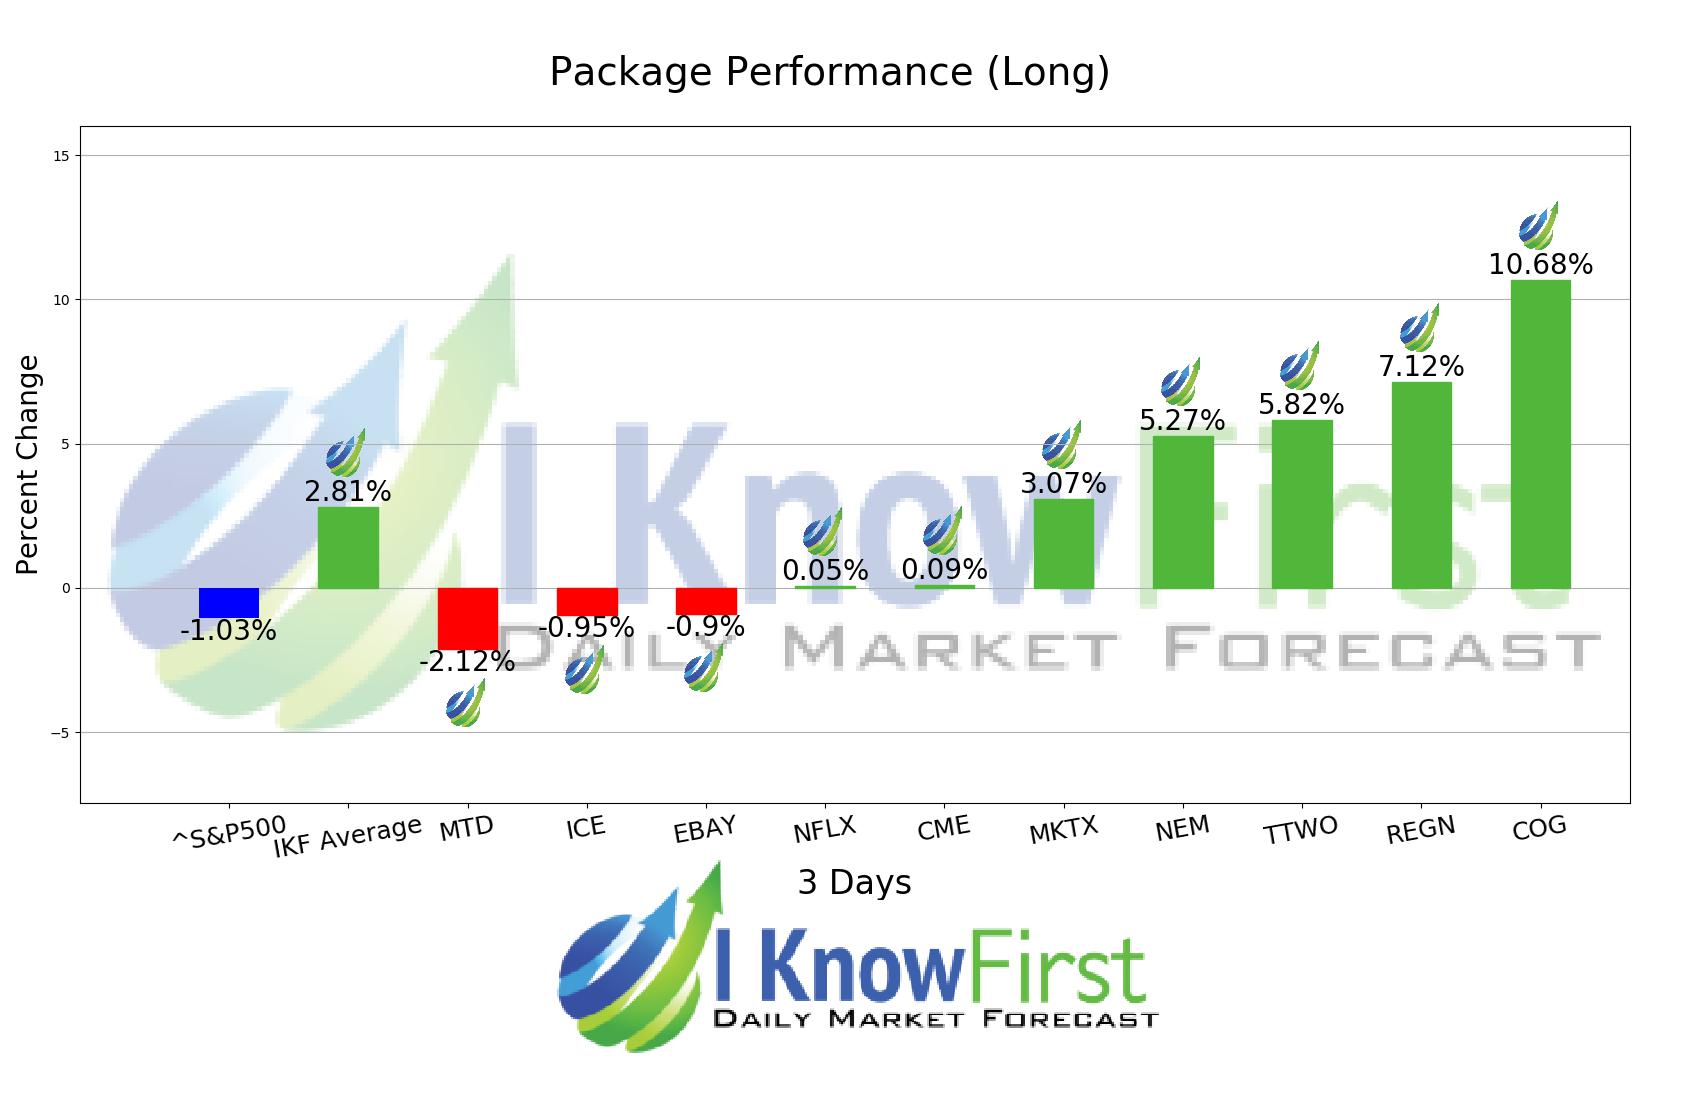
For this 3 Days forecast the algorithm had successfully predicted 7 out of 10 movements. The greatest return came from COG at 10.68%. Other notable stocks were REGN and TTWO with a return of 7.12% and 5.82%. The package had an overall average return of 2.81%, providing investors with a 3.84% premium over the S&P 500’s return of -1.03% during the period.
Cabot Oil & Gas Corporation (COG), an independent oil and gas company, develops, exploits, explores for, produces, and markets natural gas, oil, and natural gas liquids in the United States. The company primarily focuses on the Marcellus Shale in northeast Pennsylvania with approximately 200,000 net acres in the dry gas window of the play; and the Eagle Ford Shale in south Texas with approximately 85,500 net acres in the oil window of the play. It also transports, stores, gathers, and purchases natural gas for resale. The company sells its natural gas to industrial customers, local distribution companies, and gas marketers through gathering systems and pipelines, as well as to intrastate pipelines, natural gas processors, and marketing companies. As of December 31, 2015, it had proved reserves of approximately 8,190 billion cubic feet of natural gas equivalent. The company was founded in 1989 and is headquartered in Houston, Texas.
Algorithmic traders utilize these daily forecasts by the I Know First market prediction system as a tool to enhance portfolio performance, verify their own analysis and act on market opportunities faster. This forecast was sent to current I Know First subscribers.
How to interpret this diagram
Algorithmic Stock Forecast: The table on the left is a stock forecast produced by I Know First’s algorithm. Each day, subscribers receive forecasts for six different time horizons. Note that the top 10 stocks in the 1-month forecast may be different than those in the 1-year forecast. In the included table, only the relevant stocks have been included. The boxes are arranged according to their respective signal and predictability values (see below for detailed definitions). A green box represents a positive forecast, suggesting a long position, while a red represents a negative forecast, suggesting a short position.
Please note-for trading decisions use the most recent forecast. Get today’s forecast and Top stock picks.


