
Top S&P 500 Stocks Based on a Self-learning Algorithm: Returns up to 216.46% in 1 Year
Top S&P 500 Stocks
This top S&P 500 stocks forecast is designed for investors and analysts who need predictions for the whole S&P 500 (See S&P 500 Companies Package). It includes 20 stocks with bullish and bearish signals and indicates the best S&P 500 Companies stocks to buy:
- Top 10 S&P 500 stocks for the long position
- Top 10 S&P 500 stocks for the short position

Package Name: Top S&P 500 Stocks
Recommended Positions: Long
Forecast Length: 1 Year (5/28/20 – 5/28/21)
I Know First Average: 88.44%

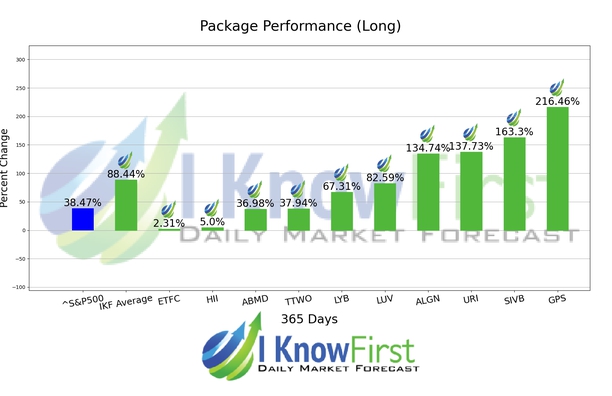
This Top S&P 500 Stocks Package forecast had correctly predicted 10 out of 10 stock movements. The highest trade return came from GPS, at 216.46%. SIVB, and URI had notable returns of 163.3% and 137.73%. The package saw an overall yield of 88.44% versus the S&P 500’s return of 38.47% implying a market premium of 49.97%.
The Gap, Inc. operates as an apparel retail company worldwide. It offers apparel, accessories, and personal care products for men, women, and children under the Gap, Banana Republic, Old Navy, Athleta, and Intermix brands. The company provides apparel, eyewear, jewelry, shoes, handbags, and fragrances; and performance and lifestyle apparel for use in yoga, strength training, and running, as well as seasonal sports, including skiing and tennis. The Gap, Inc. offers its products through company-operated stores, franchise stores, Websites, e-commerce and social media sites, and catalogs. The company has franchise agreements with unaffiliated franchisees to operate Gap, Banana Republic, and Old Navy stores in Asia, Australia, Europe, Latin America, the Middle East, and Africa. As of August 11, 2016, it operated 3,300 company-operated stores and 450 franchise stores. The company was founded in 1969 and is headquartered in San Francisco, California.
Algorithmic traders utilize these daily forecasts by the I Know First market prediction system as a tool to enhance portfolio performance, verify their own analysis and act on market opportunities faster. This forecast was sent to current I Know First subscribers.
How to interpret this diagram
Algorithmic Stock Forecast: The table on the left is a stock forecast produced by I Know First’s algorithm. Each day, subscribers receive forecasts for six different time horizons. Note that the top 10 stocks in the 1-month forecast may be different than those in the 1-year forecast. In the included table, only the relevant stocks have been included. The boxes are arranged according to their respective signal and predictability values (see below for detailed definitions). A green box represents a positive forecast, suggesting a long position, while a red represents a negative forecast, suggesting a short position.
Please note-for trading decisions use the most recent forecast. Get today’s forecast and Top stock picks.


