
Top Robinhood Stocks Based on Pattern Recognition: Returns up to 26.28% in 3 Days
Top Robinhood Stocks
This forecast is part of the Robinhood Trades Package, one of I Know First’s algorithmic trading tools. The full investment universe includes the most traded stocks by Robinhood stock trading platform users. Based on it, I Know First AI Algorithm identifies the most promising stocks and produces forecasts that include:
- Top 10 stocks from Robinhood Trades for the long position
- Top 10 stocks from Robinhood Trades for the short position

Package Name: Robinhood Trades
Recommended Positions: Long
Forecast Length: 3 Days (11/22/2020 – 11/26/2020)
I Know First Average: 12.77%
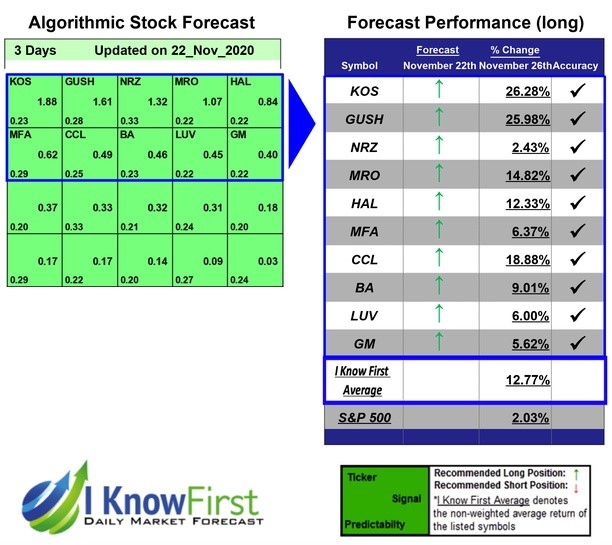

I Know First’s State of the Art Algorithm accurately forecasted 10 out of 10 trades in this Robinhood Trades Package for the 3 Days time period. The top performing prediction from this package was KOS with a return of 26.28%. The suggested trades for GUSH and CCL also had notable 3 Days yields of 25.98% and 18.88%, respectively. The package had an overall average return of 12.77%, providing investors with a premium of 10.74% over the S&P 500’s return of 2.03% during the same period.
Kosmos Energy Ltd. (KOS) explores for and produces oil and gas in Africa, Europe, and South America. Its asset portfolio includes production and other development projects in offshore Ghana, as well as exploration licenses with hydrocarbon potential in offshore Portugal, Sao Tome and Principe, Suriname, Morocco, and Western Sahara. The company was founded in 2003 and is based in Hamilton, Bermuda.
Algorithmic traders utilize these daily forecasts by the I Know First market prediction system as a tool to enhance portfolio performance, verify their own analysis and act on market opportunities faster. This forecast was sent to current I Know First subscribers.
How to interpret this diagram
Algorithmic Stock Forecast: The table on the left is a stock forecast produced by I Know First’s algorithm. Each day, subscribers receive forecasts for six different time horizons. Note that the top 10 stocks in the 1-month forecast may be different than those in the 1-year forecast. In the included table, only the relevant stocks have been included. The boxes are arranged according to their respective signal and predictability values (see below for detailed definitions). A green box represents a positive forecast, suggesting a long position, while a red represents a negative forecast, suggesting a short position.
Please note-for trading decisions use the most recent forecast. Get today’s forecast and Top stock picks.


