
Top Revolut Stocks Based on Predictive Analytics: Returns up to 55.58% in 3 Months
Top Revolut Stocks
This forecast is part of the Revolut Stock Trading Package, one of I Know First’s algorithmic trading tools. The full investment universe includes the most promising stocks presented on Revolut trading platform. Based on it, I Know First AI Algorithm identifies the top promising stocks and produces forecasts that include:
- Top 10 stocks from Revolut Trades for the long position
- Top 10 stocks from Revolut Trades for the short position
Package Name: Revolut Stock Trading
Recommended Positions: Long
Forecast Length: 3 Months (8/21/2020 – 11/22/2020)
I Know First Average: 21.39%
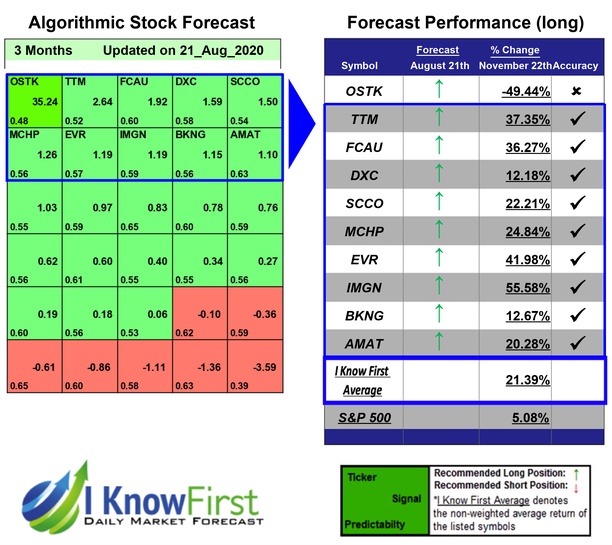

For this 3 Months forecast the algorithm had successfully predicted 9 out of 10 movements. The top-performing prediction in this forecast was IMGN, which registered a return of 55.58%. The suggested trades for EVR and TTM also had notable 3 Months yields of 41.98% and 37.35%, respectively. The package itself saw an overall return of 21.39%, providing investors with a 16.31% premium above the S&P 500’s return of 5.08% for the same time period.
ImmunoGen, Inc. (IMGN), a biotechnology company, develops targeted anticancer therapeutics. The company develops its products using its antibody-drug conjugate (ADC) technology.
Algorithmic traders utilize these daily forecasts by the I Know First market prediction system as a tool to enhance portfolio performance, verify their own analysis and act on market opportunities faster. This forecast was sent to current I Know First subscribers.
How to interpret this diagram
Algorithmic Stock Forecast: The table on the left is a stock forecast produced by I Know First’s algorithm. Each day, subscribers receive forecasts for six different time horizons. Note that the top 10 stocks in the 1-month forecast may be different than those in the 1-year forecast. In the included table, only the relevant stocks have been included. The boxes are arranged according to their respective signal and predictability values (see below for detailed definitions). A green box represents a positive forecast, suggesting a long position, while a red represents a negative forecast, suggesting a short position.
Please note-for trading decisions use the most recent forecast. Get today’s forecast and Top stock picks.


