
Top Pharma Stocks Based on Data Mining: Returns up to 14.75% in 3 Days
Top Pharma Stocks
This stock forecast is designed for investors and analysts who need predictions of the best stocks for the whole Pharmaceutical sector (see Pharma Stocks Package). It includes 20 stocks with bullish and bearish signals and indicates the best pharmaceutical stocks to trade:
- Top 10 Pharmaceutical stocks for the long position
- Top 10 Pharmaceutical stocks for the short position

Package Name: Pharma Stocks Forecast
Recommended Positions: Long
Forecast Length: 3 Days (11/27/2020 – 12/1/2020)
I Know First Average: 3.54%
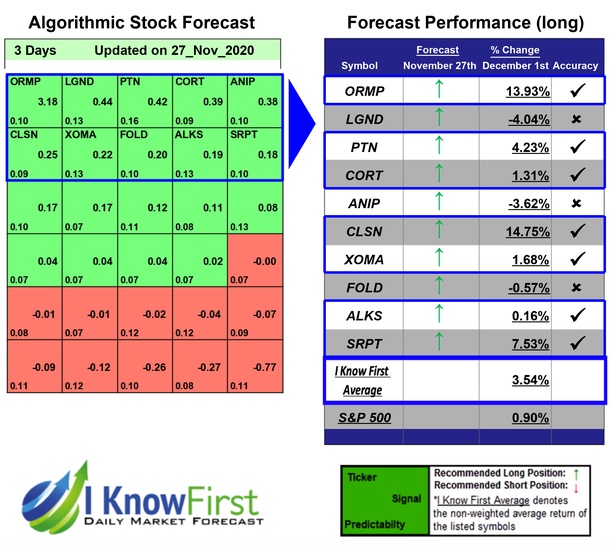
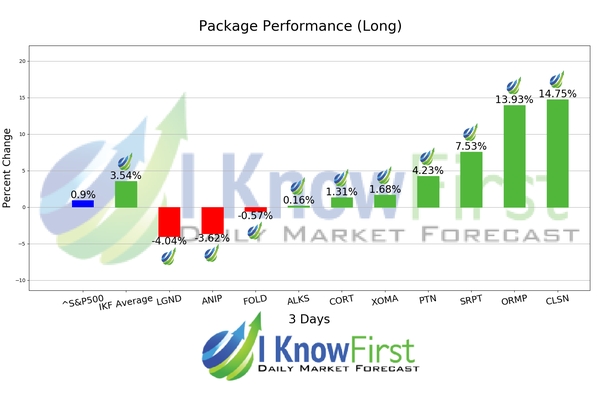
The algorithm correctly predicted 7 out 10 of the suggested trades in the Pharma Stocks Forecast Package for this 3 Days forecast. CLSN was the highest-earning trade with a return of 14.75% in 3 Days. Other notable stocks were ORMP and SRPT with a return of 13.93% and 7.53%. The package’s overall average return was 3.54%, providing investors with a 2.64% premium over the S&P 500’s return of 0.9% during the same period.
Celsion Corporation, (CLSN), an oncology drug development company, focuses on the development and commercialization of chemotherapeutic oncology drugs based on its proprietary heat-activated liposomal technology.
Algorithmic traders utilize these daily forecasts by the I Know First market prediction system as a tool to enhance portfolio performance, verify their own analysis and act on market opportunities faster. This forecast was sent to current I Know First subscribers.
How to interpret this diagram
Algorithmic Stock Forecast: The table on the left is a stock forecast produced by I Know First’s algorithm. Each day, subscribers receive forecasts for six different time horizons. Note that the top 10 stocks in the 1-month forecast may be different than those in the 1-year forecast. In the included table, only the relevant stocks have been included. The boxes are arranged according to their respective signal and predictability values (see below for detailed definitions). A green box represents a positive forecast, suggesting a long position, while a red represents a negative forecast, suggesting a short position.
Please note-for trading decisions use the most recent forecast. Get today’s forecast and Top stock picks.


