
Top Performing Stocks Based on Machine Learning: Returns up to 14.66% in 14 Days
Top Performing Stocks
This S&P 500 top performing stocks forecast is designed for investors and analysts who need predictions for the whole S&P 500 (See S&P 500 Companies Package). It includes 20 stocks with bullish and bearish signals and indicates the best S&P 500 Companies stocks to buy:
- Top 10 S&P 500 stocks for the long position
- Top 10 S&P 500 stocks for the short position

Package Name: S&P500 Companies
Recommended Positions: Long
Forecast Length: 14 Days (9/3/2019 – 9/17/2019)
I Know First Average: 8.1%
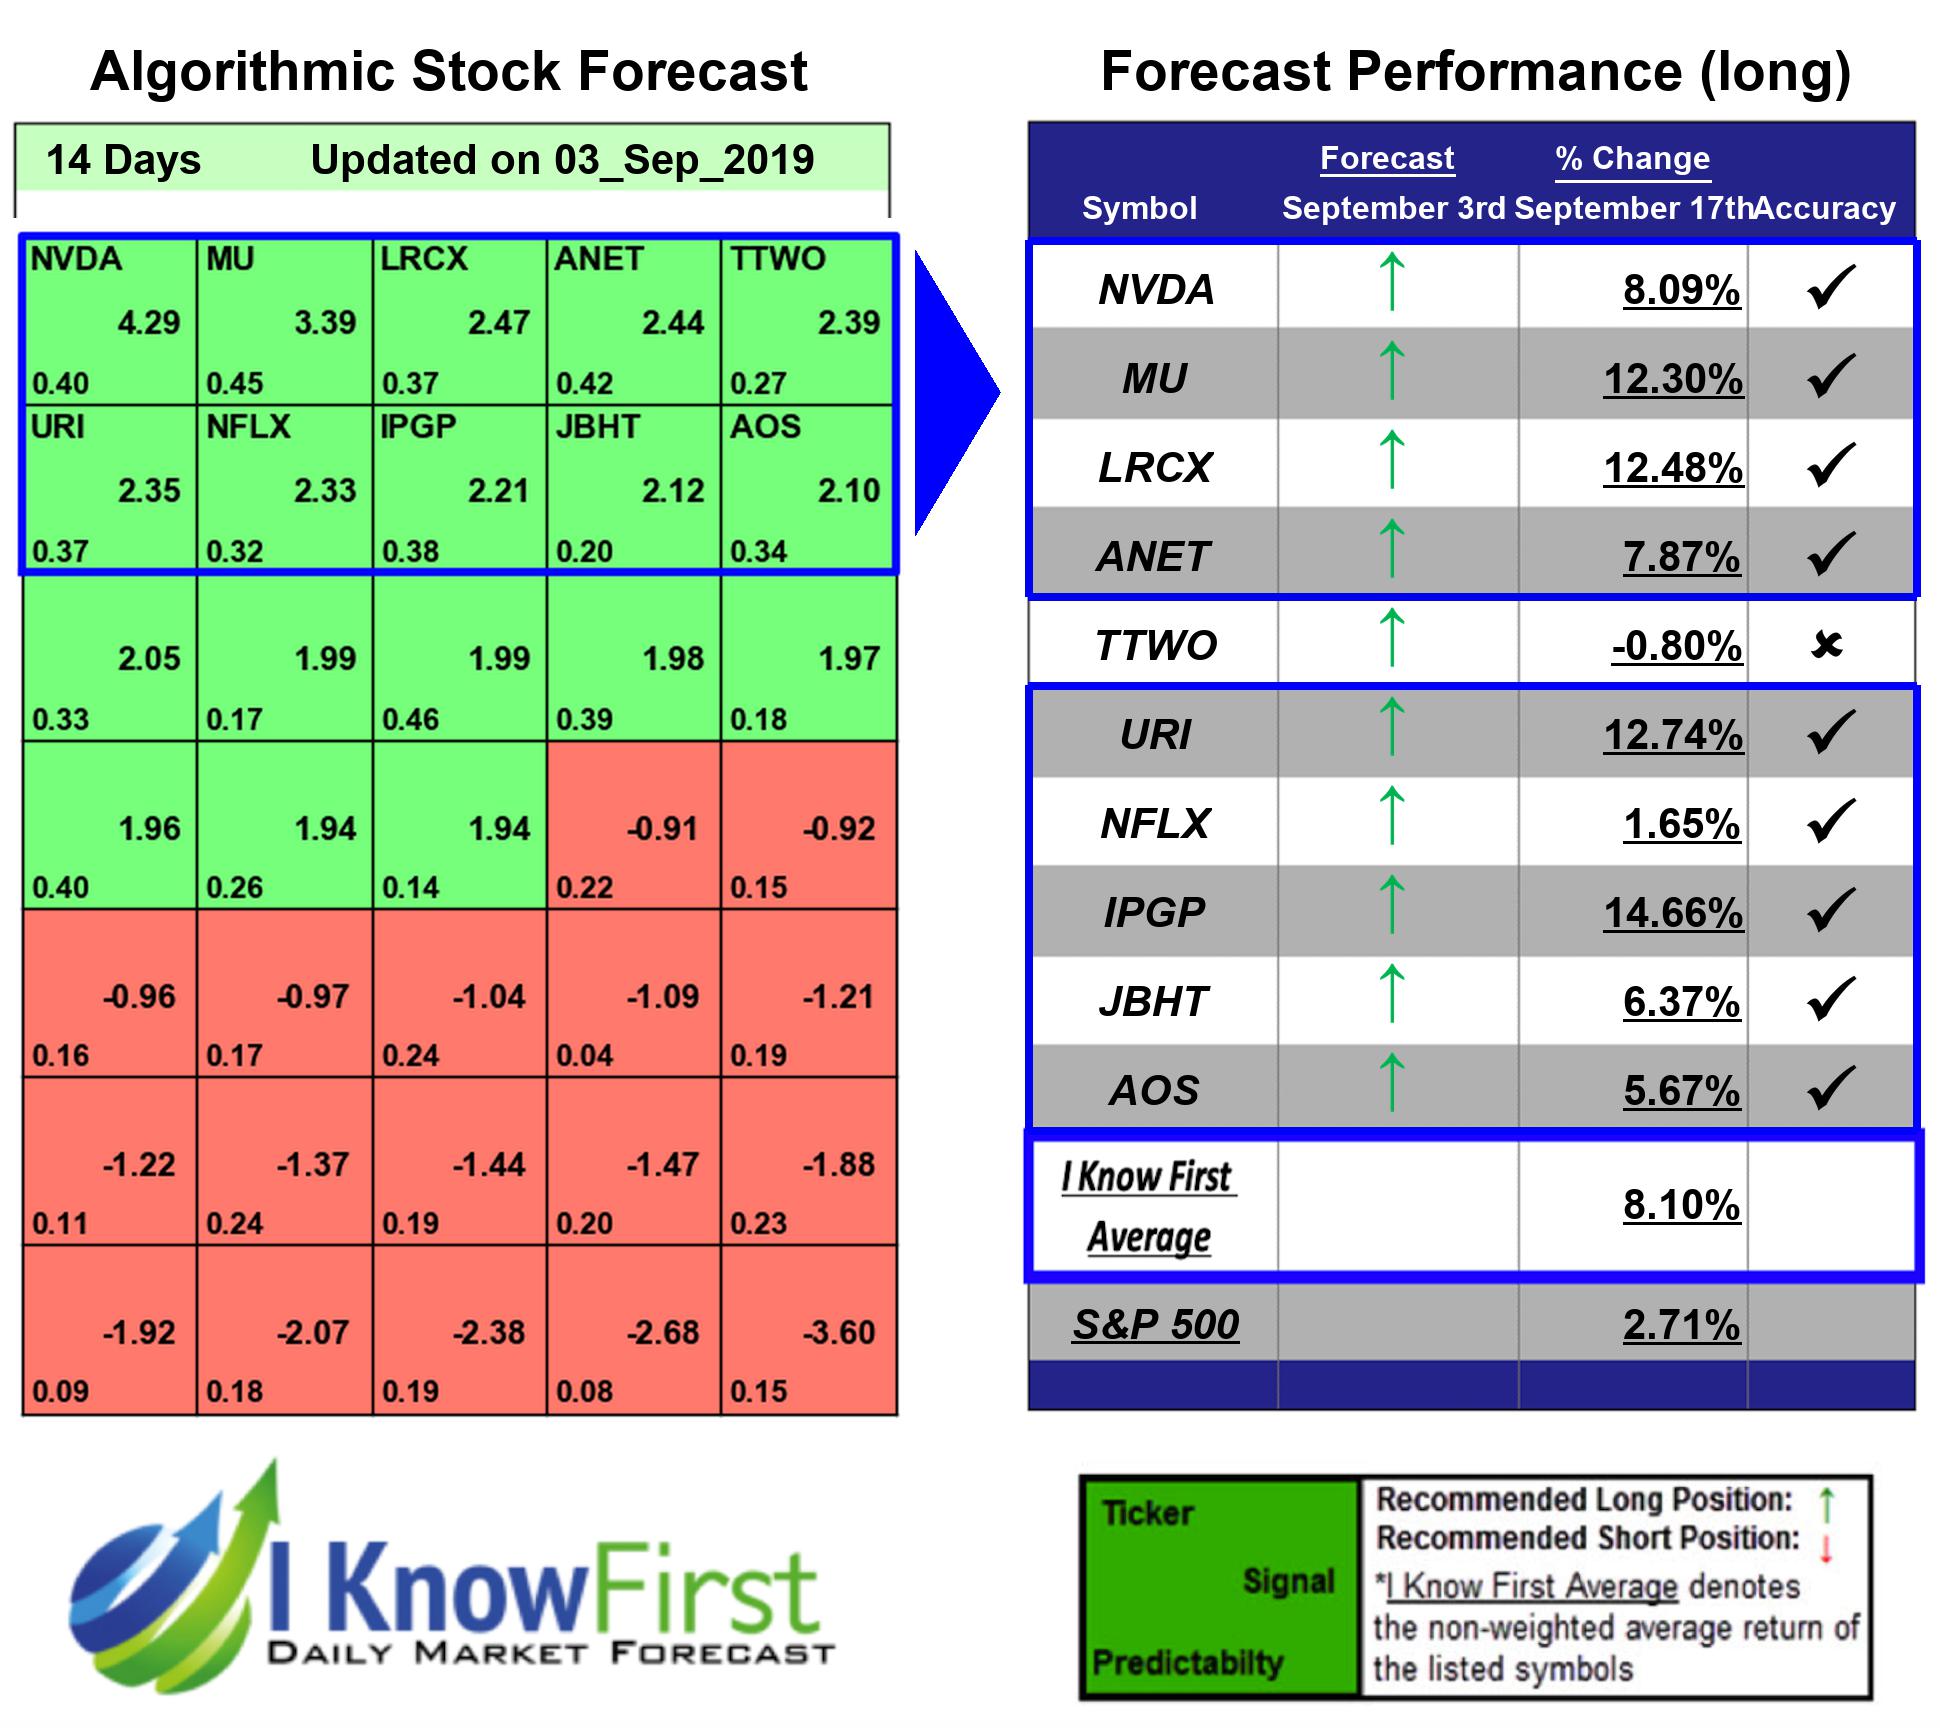

Several predictions in this 14 Days forecast saw significant returns. The algorithm had correctly predicted 9 out 10 stock movements. The greatest return came from IPGP at 14.66%. Other notable stocks were URI and LRCX with a return of 12.74% and 12.48%. The package had an overall average return of 8.1%, providing investors with a 5.39% premium over the S&P 500’s return of 2.71% during the period.
IPG Photonics Corporation, incorporated on December 2, 1998, is a developer and manufacturer of a line of fiber lasers, fiber amplifiers, diode lasers, laser systems and optical accessories that are used for various applications. The Company offers a line of lasers and amplifiers, which are used in materials processing, communications and medical applications. The Company sells its products globally to original equipment manufacturers (OEMs), system integrators and end users. The Company’s manufacturing facilities are located in the United States, Germany and Russia. The Company offers laser-based systems for certain markets and applications. The Company also makes packaged diodes, direct diode lasers, laser systems and communications components and systems. Its products are designed to be used as general-purpose energy or light sources.
Algorithmic traders utilize these daily forecasts by the I Know First market prediction system as a tool to enhance portfolio performance, verify their own analysis and act on market opportunities faster. This forecast was sent to current I Know First subscribers.
How to interpret this diagram
Algorithmic Stock Forecast: The table on the left is a stock forecast produced by I Know First’s algorithm. Each day, subscribers receive forecasts for six different time horizons. Note that the top 10 stocks in the 1-month forecast may be different than those in the 1-year forecast. In the included table, only the relevant stocks have been included. The boxes are arranged according to their respective signal and predictability values (see below for detailed definitions). A green box represents a positive forecast, suggesting a long position, while a red represents a negative forecast, suggesting a short position.
Please note-for trading decisions use the most recent forecast. Get today’s forecast and Top stock picks.


