
Top Mid Cap Stocks Based on Machine Learning: Returns up to 23.23% in 1 Month
Top Mid Cap Stocks
This Best Mid Cap Stocks forecast is designed for investors and analysts who need predictions for the best companies with market capitalization between USD 500m and USD 50b. It includes 20 stocks with bullish and bearish signals:
- Top 10 Mid Cap stocks for the long position
- Top 10 Mid Cap stocks for the short position
Package Name: Best Mid Cap Stocks
Recommended Positions: Long
Forecast Length: 1 Month (11/17/2020 – 12/17/2020)
I Know First Average: 11.09%
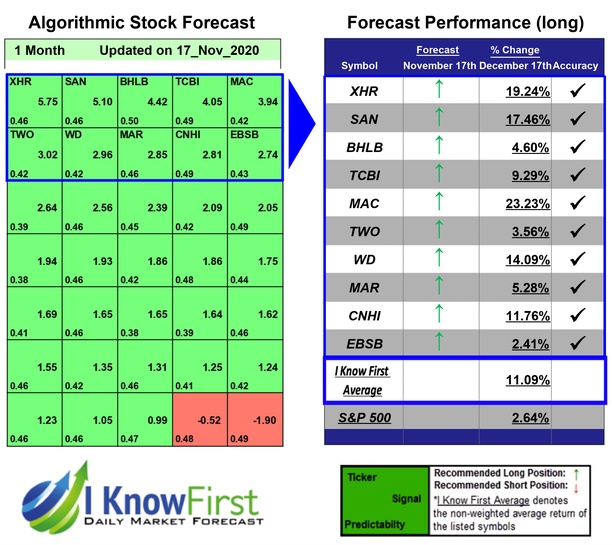
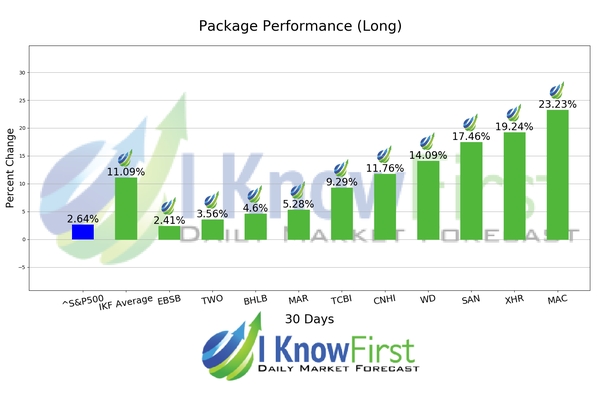
The algorithm correctly predicted 10 out 10 of the suggested trades in the Best Mid Cap Stocks Package for this 1 Month forecast. The top-performing prediction in this forecast was MAC, which registered a return of 23.23%. XHR and SAN also performed well for this time horizon with returns of 19.24% and 17.46%, respectively. With these notable trade returns, the package itself registered an average return of 11.09% compared to the S&P 500’s return of 2.64% for the same period.
The Macerich Company is an independent real estate investment trust. The firm invests in the real estate markets of the United States. It primarily engages in acquisition, ownership, development, redevelopment, management and leasing of regional and community shopping centers located throughout the United States. The Macerich Company was founded in 1964 and is headquartered in Santa Monica, California with additional offices in Phoenix, Arizona; Dallas, Texas; Pittsford, New York.
Algorithmic traders utilize these daily forecasts by the I Know First market prediction system as a tool to enhance portfolio performance, verify their own analysis and act on market opportunities faster. This forecast was sent to current I Know First subscribers.
How to interpret this diagram
Algorithmic Stock Forecast: The table on the left is a stock forecast produced by I Know First’s algorithm. Each day, subscribers receive forecasts for six different time horizons. Note that the top 10 stocks in the 1-month forecast may be different than those in the 1-year forecast. In the included table, only the relevant stocks have been included. The boxes are arranged according to their respective signal and predictability values (see below for detailed definitions). A green box represents a positive forecast, suggesting a long position, while a red represents a negative forecast, suggesting a short position.
Please note-for trading decisions use the most recent forecast. Get today’s forecast and Top stock picks.


