
Top Mid Cap Stocks Based on Big Data: Returns up to 6.83% in 7 Days
Top Mid Cap Stocks
This Best Mid Cap Stocks forecast is designed for investors and analysts who need predictions for the best companies with market capitalization between USD 500m and USD 50b. It includes 20 stocks with bullish and bearish signals:
- Top 10 Mid Cap stocks for the long position
- Top 10 Mid Cap stocks for the short position
Package Name: Best Mid Cap Stocks
Recommended Positions: Long
Forecast Length: 7 Days (5/12/22 – 5/19/22)
I Know First Average: 1.5%
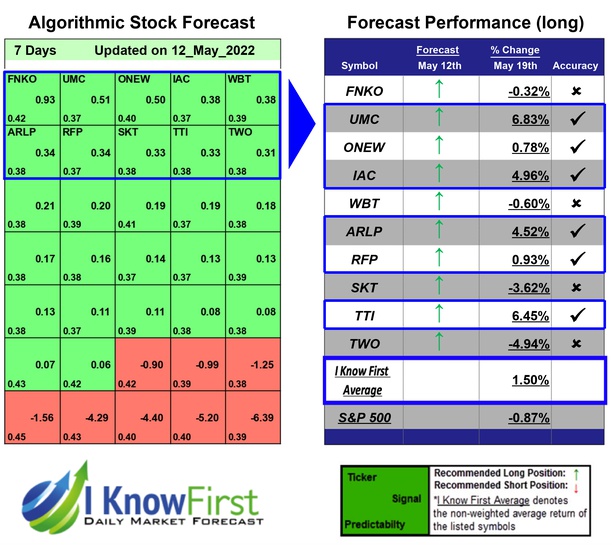
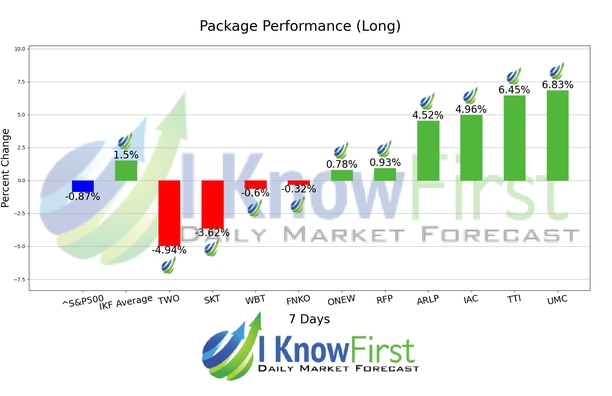
I Know First’s State of the Art Algorithm accurately forecasted 6 out of 10 trades in this Best Mid Cap Stocks Package for the 7 Days time period. The highest trade return came from UMC, at 6.83%. The suggested trades for TTI and IAC also had notable 7 Days yields of 6.45% and 4.96%, respectively. The package had an overall average return of 1.5%, providing investors with a premium of 2.37% over the S&P 500’s return of -0.87% during the same period.
United Microelectronics Corporation (UMC) provides semiconductor wafer foundry solutions. It provides circuit design, mask tooling, wafer fabrication, and assembly and testing services. The company also engages in the research, development, and manufacture of products in the solar energy and LED industries. It primarily serves integrated device manufacturers and fabless design companies. The company operates primarily in Taiwan, Japan, Korea, China, Singapore, Europe, and the United States. United Microelectronics Corporation (UMC) was founded in 1980 and is headquartered in Hsinchu, Taiwan.
Algorithmic traders utilize these daily forecasts by the I Know First market prediction system as a tool to enhance portfolio performance, verify their own analysis and act on market opportunities faster. This forecast was sent to current I Know First subscribers.
How to interpret this diagram
Algorithmic Stock Forecast: The table on the left is a stock forecast produced by I Know First’s algorithm. Each day, subscribers receive forecasts for six different time horizons. Note that the top 10 stocks in the 1-month forecast may be different than those in the 1-year forecast. In the included table, only the relevant stocks have been included. The boxes are arranged according to their respective signal and predictability values (see below for detailed definitions). A green box represents a positive forecast, suggesting a long position, while a red represents a negative forecast, suggesting a short position.
Please note-for trading decisions use the most recent forecast. Get today’s forecast and Top stock picks.


