
Top Dividend Stocks Based on Stock Market Algorithm: Returns up to 23.21% in 14 Days
Top Dividend Stocks
This forecast is part of the Dividends Package, as one of I Know First’s quantitative investment solutions. We determine the best stocks carrying a dividend by screening our database daily using our advanced algorithm. The full Dividends Package includes a daily forecast for a total of 20 stocks with bullish and bearish signals:
- Top 10 Dividend stocks for the long position
- Top 10 Dividend stocks for the short position

Package Name: Dividend Stocks Forecast
Recommended Positions: Long
Forecast Length: 14 Days (11/3/2019 – 11/18/2019)
I Know First Average: 3.27%
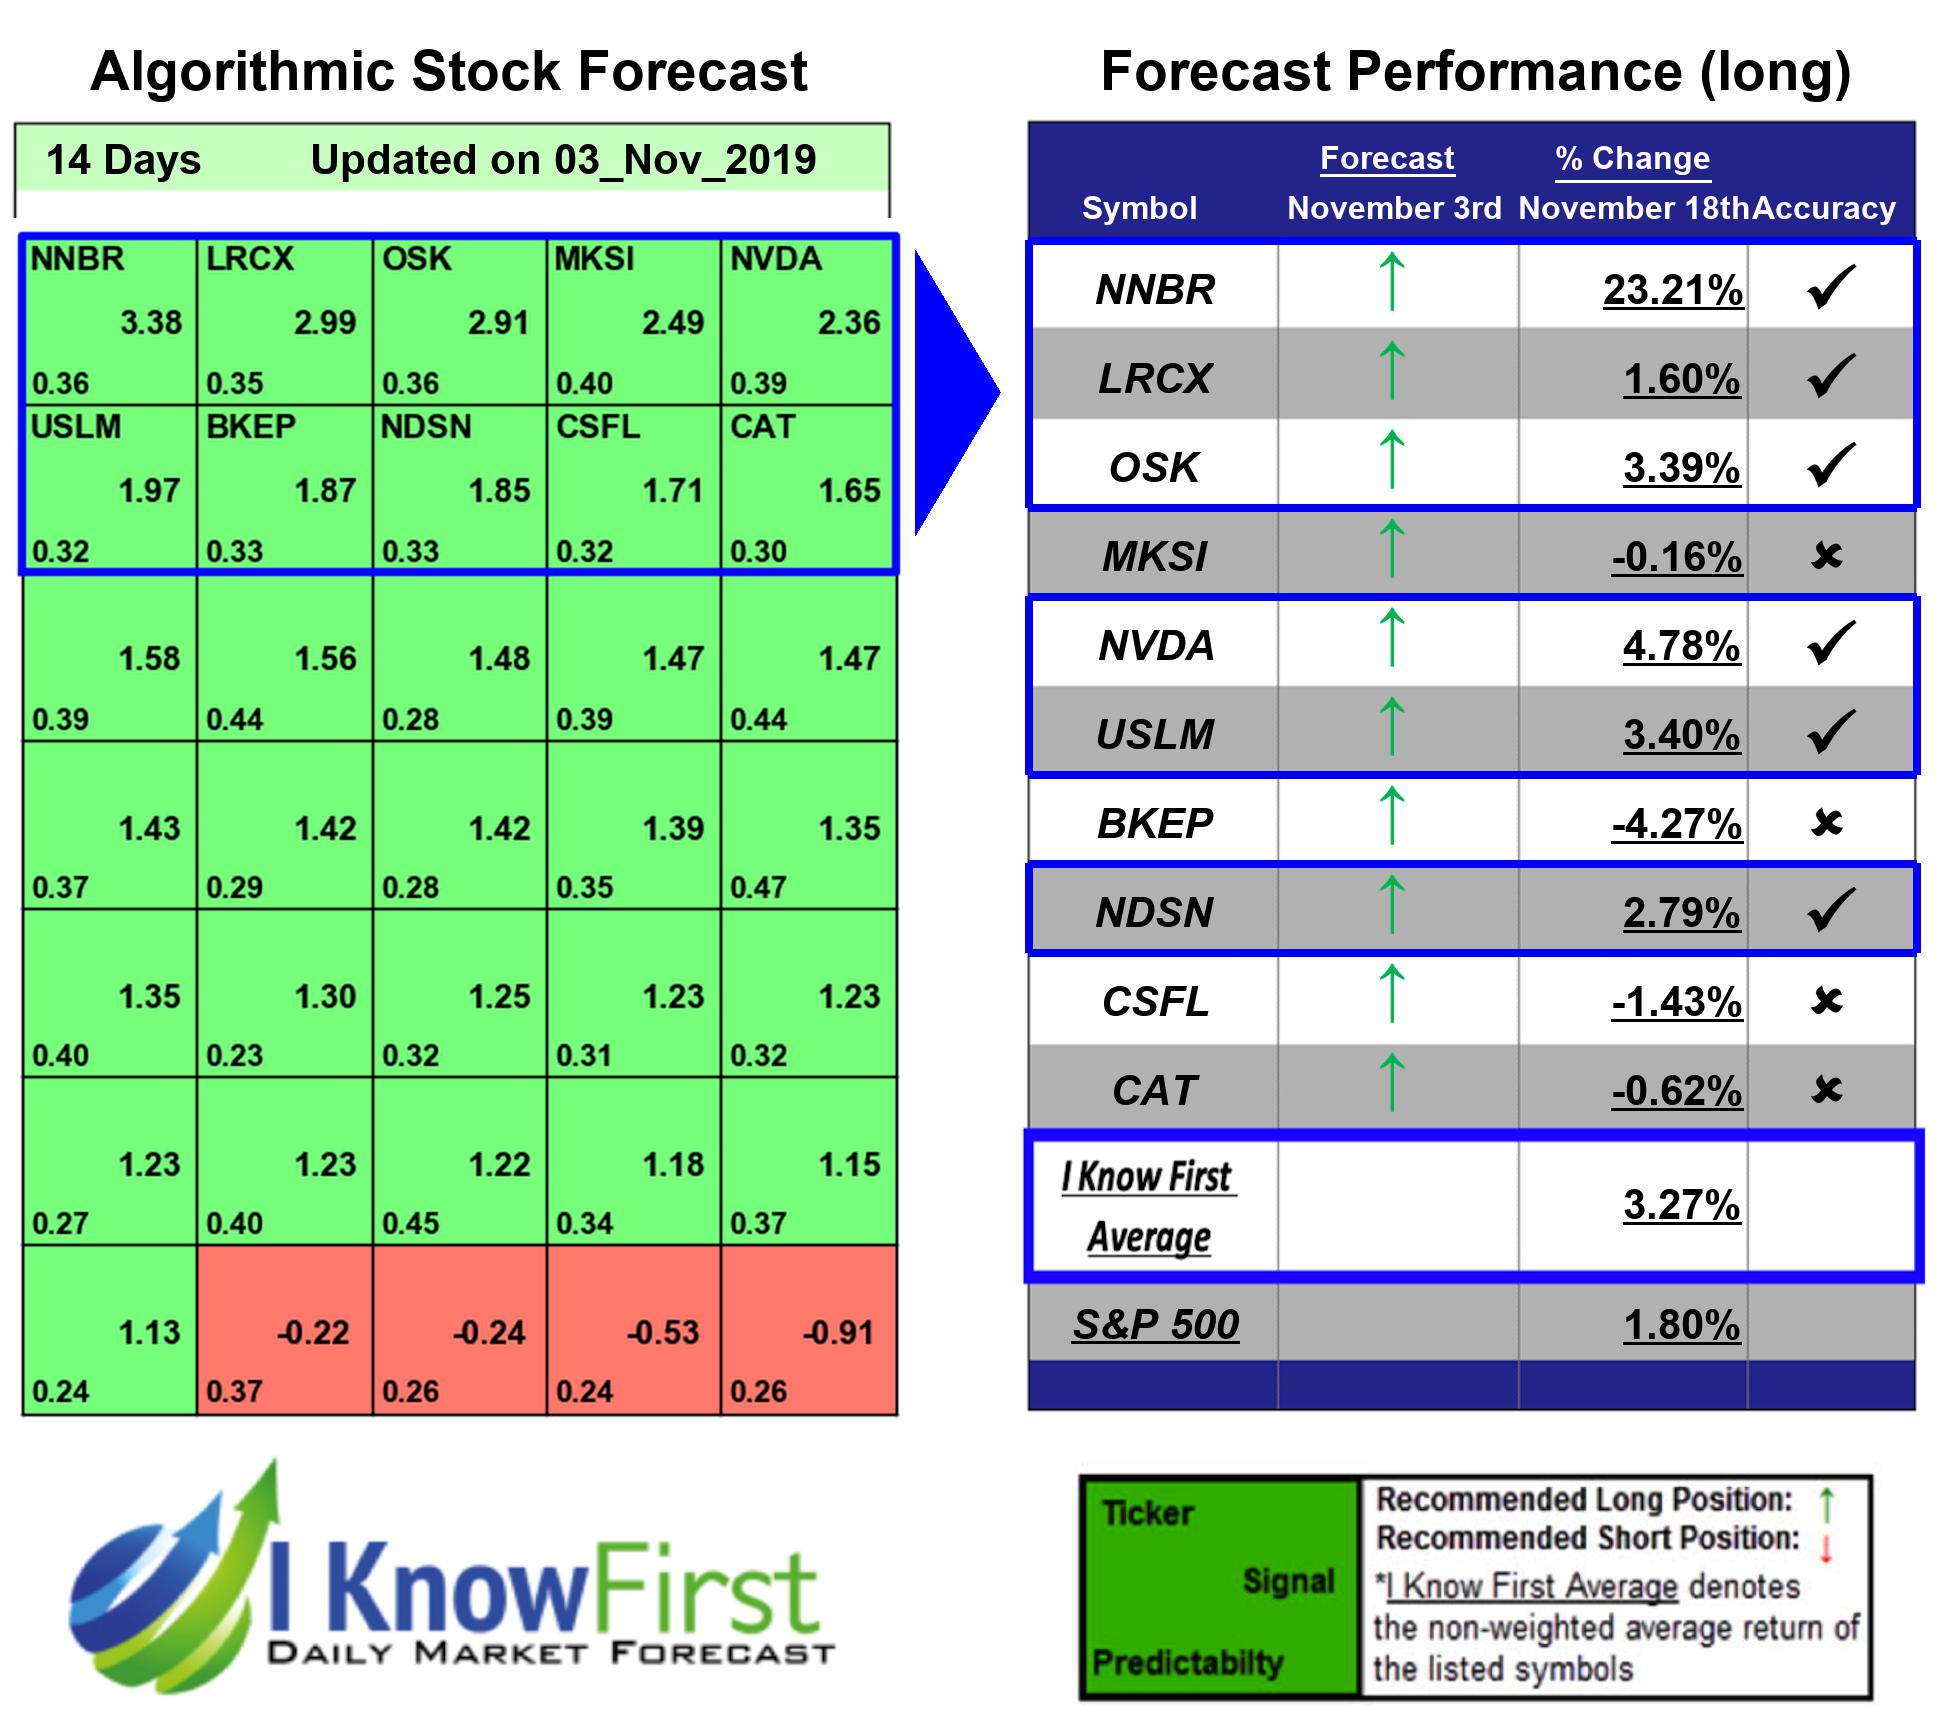

Several predictions in this 14 Days forecast saw significant returns. The algorithm had correctly predicted 6 out 10 stock movements. The highest trade return came from NNBR, at 23.21%. The suggested trades for NVDA and USLM also had notable 14 Days yields of 4.78% and 3.4%, respectively. The package saw an overall yield of 3.27% versus the S&P 500’s return of 1.8% implying a market premium of 1.47%.
NN, Inc., incorporated on October 12, 1993, is a diversified industrial company and a global manufacturer of high precision components and assemblies to a range of markets on a global basis. The Company’s operating segments include: the Precision Engineered Products Group and the Autocam Precision Components Group.
Algorithmic traders utilize these daily forecasts by the I Know First market prediction system as a tool to enhance portfolio performance, verify their own analysis and act on market opportunities faster. This forecast was sent to current I Know First subscribers.
How to interpret this diagram
Algorithmic Stock Forecast: The table on the left is a stock forecast produced by I Know First’s algorithm. Each day, subscribers receive forecasts for six different time horizons. Note that the top 10 stocks in the 1-month forecast may be different than those in the 1-year forecast. In the included table, only the relevant stocks have been included. The boxes are arranged according to their respective signal and predictability values (see below for detailed definitions). A green box represents a positive forecast, suggesting a long position, while a red represents a negative forecast, suggesting a short position.
Please note-for trading decisions use the most recent forecast. Get today’s forecast and Top stock picks.


