
Top Biotech Stocks Based on Pattern Recognition: Returns up to 553.21% in 3 Months
Top Biotech Stocks
The BioTech Stocks Package is designed for investors and analysts who need predictions of the best stocks to buy for the whole Biotechnology Industry. It includes 20 stocks with bullish and bearish signals and indicates the best biotech stocks to trade:
- Top 10 Biotech stocks for the long position
- Top 10 Biotech stocks for the short position

Package Name: Biotech Stocks Forecast
Recommended Positions: Long
Forecast Length: 3 Months (4/23/2020 – 7/23/2020)
I Know First Average: 121.77%
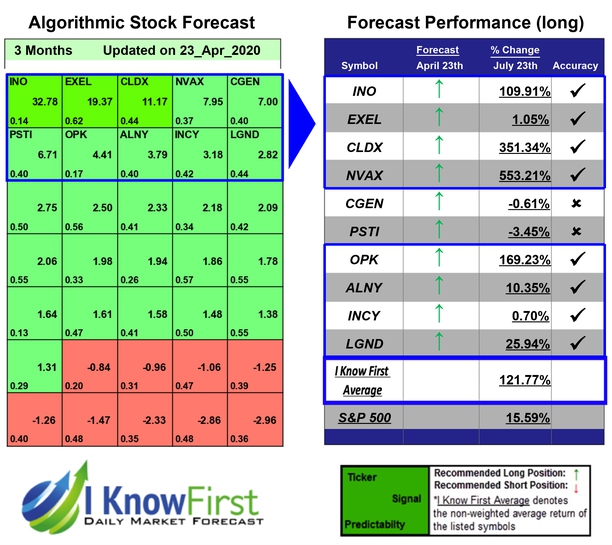
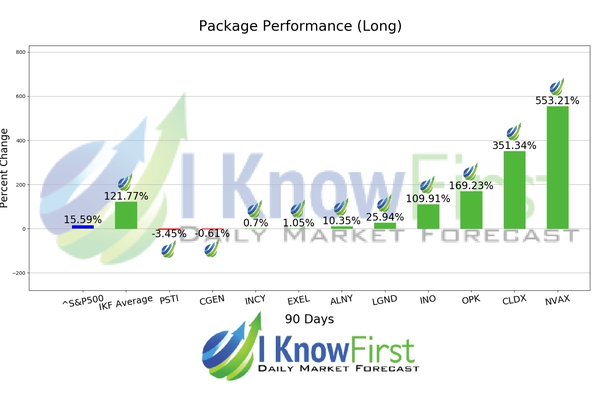
In this 3 Months forecast for the Biotech Stocks Forecast Package, there were many high performing trades and the algorithm correctly predicted 8 out 10 trades. The prediction with the highest return was NVAX, at 553.21%. Other notable stocks were CLDX and OPK with a return of 351.34% and 169.23%. The package’s overall average return was 121.77%, providing investors with a 106.18% premium over the S&P 500’s return of 15.59% during the same period.
Novavax, Inc. (NVAX) is a clinical stage biotechnology company. The Company creates novel vaccines to address a broad range of infectious diseases worldwide using proprietary virus-like particle (VLP) technology.
Algorithmic traders utilize these daily forecasts by the I Know First market prediction system as a tool to enhance portfolio performance, verify their own analysis and act on market opportunities faster. This forecast was sent to current I Know First subscribers.
How to interpret this diagram
Algorithmic Stock Forecast: The table on the left is a stock forecast produced by I Know First’s algorithm. Each day, subscribers receive forecasts for six different time horizons. Note that the top 10 stocks in the 1-month forecast may be different than those in the 1-year forecast. In the included table, only the relevant stocks have been included. The boxes are arranged according to their respective signal and predictability values (see below for detailed definitions). A green box represents a positive forecast, suggesting a long position, while a red represents a negative forecast, suggesting a short position.
Please note-for trading decisions use the most recent forecast. Get today’s forecast and Top stock picks.


