Top 10 Retail Stocks Based on Predictive Analytics: Returns up to 13.46% in 3 Days
Top 10 Retail Stocks
This Retail Stocks forecast is designed for investors and analysts who need predictions for the best stocks to invest in the retail estate sector (see Retail Stocks Package). It includes top 10 retail stocks for bullish and for bearish signals:
- Top 10 Retail stocks for the long position
- Top 10 Retail stocks for the short position
Package Name: Retail Stocks
Recommended Positions: Long
Forecast Length: 3 Days (8/28/2020 – 9/1/2020)
I Know First Average: 4.26%
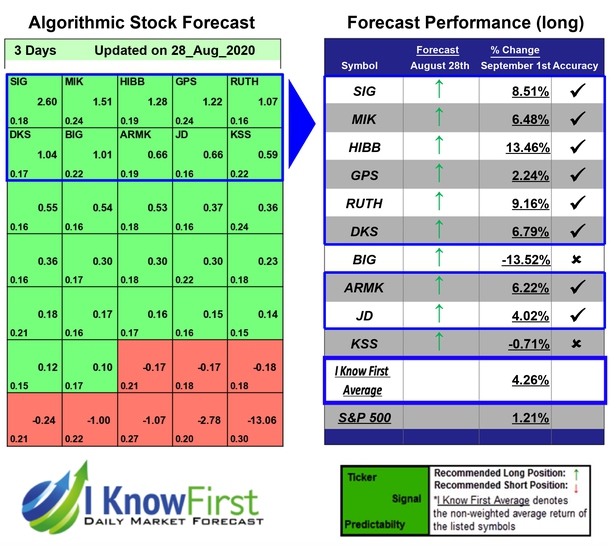

During the 3 Days forecasted period several picks in the Retail Stocks Package saw significant returns. The algorithm had correctly predicted 8 out 10 returns. HIBB was the top performing prediction with a return of 13.46%. Other notable stocks were RUTH and SIG with a return of 9.16% and 8.51%. The package saw an overall yield of 4.26% versus the S&P 500’s return of 1.21% implying a market premium of 3.05%.
Hibbett Sports, Inc., incorporated on January 4, 2007, operates athletic specialty stores in small and mid-sized markets in the South, Southwest, Mid-Atlantic and the Midwest regions of the United States. As of January 28, 2017, the Company had operated 1,078 stores consisting of 1,059 Hibbett Sports stores and 19 smaller-format Sports Additions athletic shoe stores in 35 states. The Company offers convenient locations and an assortment of brand name footwear, apparel, accessories and athletic equipment. The Company operates under various brands, such as Nike, Under Armour, Reebok, adidas, Easton and The North Face.
Algorithmic traders utilize these daily forecasts by the I Know First market prediction system as a tool to enhance portfolio performance, verify their own analysis and act on market opportunities faster. This forecast was sent to current I Know First subscribers.
How to interpret this diagram
Algorithmic Stock Forecast: The table on the left is a stock forecast produced by I Know First’s algorithm. Each day, subscribers receive forecasts for six different time horizons. Note that the top 10 stocks in the 1-month forecast may be different than those in the 1-year forecast. In the included table, only the relevant stocks have been included. The boxes are arranged according to their respective signal and predictability values (see below for detailed definitions). A green box represents a positive forecast, suggesting a long position, while a red represents a negative forecast, suggesting a short position.
Please note-for trading decisions use the most recent forecast. Get today’s forecast and Top stock picks.