Tiffany & Co. Shining to the Top
“Simplicity is the keynote of all true elegance” – Coco Chanel

Summary:
- Tiffany & Co New and Shining
- Q1 Results Above All Expectations
- Current I Know First Algorithm Bullish Forecast For TIF
Tiffany & Co., through its subsidiaries, designs, manufactures, and retails jewelry and other items in the Americas, the Asia-Pacific, Japan, Europe, and internationally. The company offers jewelry collections, engagement rings, and wedding bands. It also sells timepieces, leather goods, sterling silver goods, china, crystal, stationery, eyewear, fragrances, and other accessories; and wholesales diamonds and earnings. The company sells its products through retail, Internet and catalog, business-to-business, and wholesale distribution channels. As of January 31, 2018, it operated 315 stores, including 124 stores in the Americas, 87 stores in the Asia-Pacific, 54 stores in Japan, 46 stores in Europe, and 4 stores in the United Arab Emirates. Tiffany & Co. was founded in 1837 and is headquartered in New York, New York.
New and Shining- Strategic Priorities
Earlier this year, Tiffany’s CEO Alessandro Bogliolo outlined six strategic priorities for the company. Among these strategic priorities are- Amplifying an evolved brand message, Renewing its product offerings and enhancing in-store presentations, Delivering an “exciting” omnichannel customer experience, Strengthening its competitive position and leading key markets, Cultivating a more efficient operating model and Inspiring an “aligned and agile” organization to win.
Tiffany started achieving those goals and is still in progress. Tiffany launched on March, 2018 a new “Believe in Love” marketing campaign which highlights racial and sexual diversity in order to renovate its brand message for younger shoppers. I believe that the campaign contributed to Tiffany’s 11% growth in engagement Jewelry sales during Q1.
In line with the priority of renewing product offerings, Tiffany unveiled “PAPER FLOWERS”, a major collection in platinum and diamonds. This collection combines everyday jewelry together with one-of-a-kind pieces for the first time ever at Tiffany. The collection’s concept is creating a fine jewelry/high jewelry collection that anyone can buy or feel that it fits into their life. This strategic move is a very important launch for the company since it has high jewelry and fine jewelry at different and lower price ranges.

In addition, Tiffany invested in improving its website and started selling a curated selection of jewelry on fashion e-tailer Farfetch in over 40 countries in attempt to deliver an “exciting” omnichannel experience. The new strategic selling action complements Tiffany’s e-commerce partnership with Net-A-Porter and helps Tiffany sell products beyond the 13 countries where it operates its own e-commerce sites.
Tiffany recently opened a new jewelry, design, and innovation workshop near its corporate office in New York City in order to improve its operating efficiency. This new workshop allows the company’s model makers, designers, and engineers to all work under the same roof and develops a more efficient operating model.
Tiffany Q1 Results of 2018
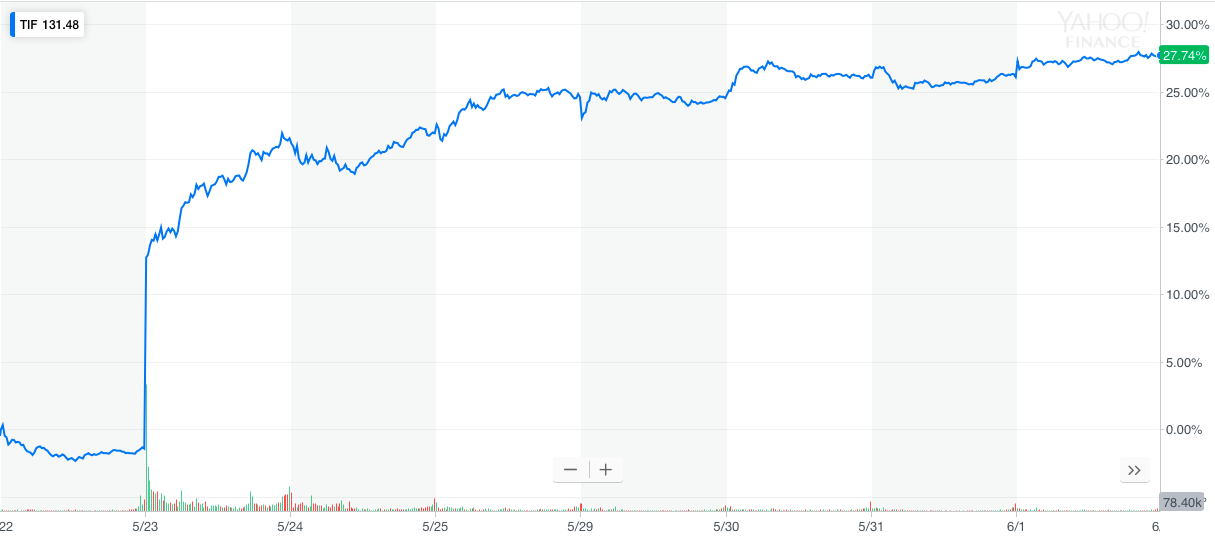
On May 23, Tiffany & Co. released its financial Q1 results of 2018 that rose above all analysts’ expectations. Starting the day trading at $119.32, Tiffany & Co. reached an intraday of $126.64. Shares gained $23.81 by the day ended. In Q1 of 2018, we can specifically see that worldwide net sales rose 15% to $1.0 billion, resulting from broad-based sales growth which, combined with a higher operating margin and a lower effective tax rate, resulted in a 53% increase in net earnings. Net earnings increased to $142 million, or $1.14 per diluted share, from last year’s $93 million, or $0.74 per diluted share. These extraordinary financial Q1 results should draw investors’ attention in a positive direction to see that the company is on a significant growing path.

On can see that although, Tiffany had a GAAP reported decrease of 21% in net sales and 7% decrease in comparable sales in some other region that are not stated, it didn’t have much effect on the company’s worldwide total net sales increase of 15% and worldwide total comparable sales increase of 10%. In addition, the company also had a decrease in Constant-Exchange-Rate Basis in both net sales and comparable sales in the other region that are not stated. These decreases did not affect the company’s worldwide total increase in either of the sales.
As shown below, Tiffany topped the market and all the analysts’ expectations with its sales growth across all of its global regions accelerated dramatically.
| Region | Constant Currency Sales Growth | Comps Growth |
| U.S.A | 8% | 9% |
| Asia | 23% | 9% |
| Japan | 12% | 9% |
| Europe | 1% | -9% |
| Total | 11% | 7% |
My estimation is that Tiffany’s surging sales growth indicates that its improving strategy efforts are paying off. Global sales growth was stronger than anticipated and mainly benefited from strong sales to tourists from China and from a weak dollar. In Europe most of the growth came from new store openings. As of today, Tiffany is still thriving across most markets except for Europe, where it’s still struggling with lower tourist spending and newer stores in older locations.
| Region | Q2 2017 | Q3 2017 | Q4 2017 | Q4 2018 |
| U.S.A | 1% | 1% | 5% | 9% |
| Asia | 2% | 15% | 13% | 28% |
| Japan | 1% | -8% | 2% | 17% |
| Europe | 3% | 5% | 13% | 13% |
Fiscal 2018 Outlook
Following the better-than-expected results, Tiffany raised its guidance for fiscal 2018. Tiffany now envisions worldwide net sales increasing by a high-single-digit percentage over the prior year and net earnings increasing to $4.50 – $4.70 per share, compared with the previous guidance of $4.25-$4.45 per share.
Conclusion
Following the above, TIF stock increased by 27.74% since the Q1 results of 2018 were announced. Tiffany’s efforts to improve its strategic priorities are paying off and led to a stronger sales growth than anticipated.
My conclusion is that TIF stock will continue to grow in the long term given the fact that it is a solid company that keeps improving, renewing and adjusting its strategy according to market trends.
In a 1 year look back one can see that TIF stock had a few ups and downs but in the long-term outlook the stock keeps going up.
Tiffany’s strategic priorities are also paying off in comparison to the industry of Retail – Jewelry. As of this year Tiffany is the industry leader in Growth Rates and Financials.
| Growth Rates | ||
| Tiffany & Co. Per Share | Industry Per Share | |
| 2018 | $23.81 | $7 |
| Last 5 Years | $3.2 | $11.1 |
As one can see above, Tiffany’s growth rates per share rose by about 10% from the last 5 years thanks to its improving strategic and new priority and is expected to continue with this growing path for the long-term. This Shows how Tiffany & Co is currently is ranked the highest in the industry of Retail – Jewelry.
According to analyst recommendations from Yahoo Finance, the current consensus is a “Buy” in Tiffany & Co. Stock, with 6 advising a “Strong Buy” and 7 advising a “Buy”.

Current bullish I Know First Algorithm forecast for TIF
Tiffany & Co. is a successful solid company and investors should buy and hold on to TIF’s stock because the company is raising and shining its way up. I Know First Algorithm is currently bullish for TIF stock which appears to be bullish for 1, 3 and 12 months investment horizons.

How to read the I Know First Forecast
Please note-for trading decisions use the most recent forecast. Get today’s forecast and Top stock picks.