
Tech Stocks To Buy Based on Stock Prediction Algorithm: Returns up to 24.13% in 14 Days
Tech Stocks To Buy
This Tech Stock forecast is based on stock picking strategies for investors and analysts who need predictions for the 10 best tech stocks to buy in the Technology Industry (see Tech Stocks Package). It includes 20 stocks with bullish and bearish signals:
- Top 10 Tech stocks for the long position
- Top 10 Tech stocks for the short position
Package Name: Tech Stocks Forecast
Recommended Positions: Long
Forecast Length: 14 Days (5/16/21 – 5/31/21)
I Know First Average: 6.41%
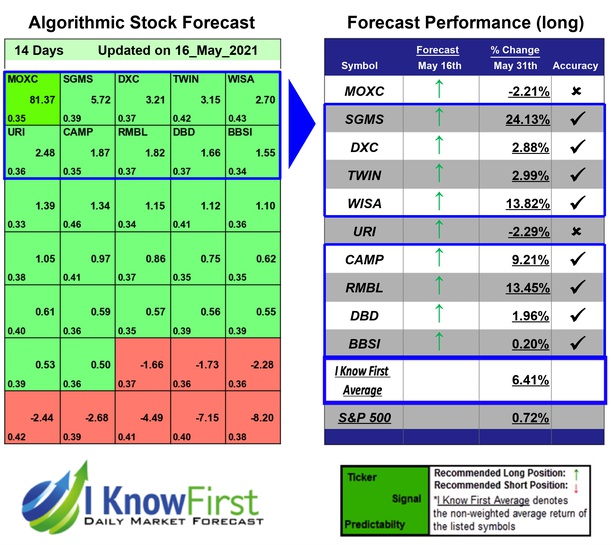
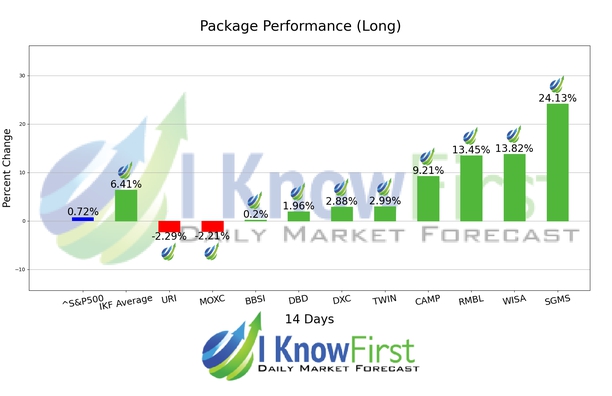
I Know First’s State of the Art Algorithm accurately forecasted 8 out of 10 trades in this Tech Stocks Forecast Package for the 14 Days time period. The top performing prediction from this package was SGMS with a return of 24.13%. WISA and RMBL saw outstanding returns of 13.82% and 13.45%. The overall average return in this Tech Stocks Forecast package was 6.41%, providing investors with a 5.69% premium over the S&P 500’s return of 0.72% during the same period.
Scientific Games Corporation develops technology-based products and services, and associated content for the gaming, lottery, and interactive gaming industries worldwide. Its Gaming segment sells new and used gaming machines, electronic table systems, video lottery terminals (VLTs), conversion game kits, and spare parts; and slot, casino, and table-management systems, as well as leases VLTs and electronic table games.
Algorithmic traders utilize these daily forecasts by the I Know First market prediction system as a tool to enhance portfolio performance, verify their own analysis and act on market opportunities faster. This forecast was sent to current I Know First subscribers.
How to interpret this diagram
Algorithmic Stock Forecast: The table on the left is a stock forecast produced by I Know First’s algorithm. Each day, subscribers receive forecasts for six different time horizons. Note that the top 10 stocks in the 1-month forecast may be different than those in the 1-year forecast. In the included table, only the relevant stocks have been included. The boxes are arranged according to their respective signal and predictability values (see below for detailed definitions). A green box represents a positive forecast, suggesting a long position, while a red represents a negative forecast, suggesting a short position.
Please note-for trading decisions use the most recent forecast. Get today’s forecast and Top stock picks.


