
Tech Stocks To Buy Based on Pattern Recognition: Returns up to 45.91% in 14 Days
Tech Stocks To Buy
This Tech Stock forecast is based on stock picking strategies for investors and analysts who need predictions for the 10 best tech stocks to buy in the Technology Industry (see Tech Stocks Package). It includes 20 stocks with bullish and bearish signals:
- Top 10 Tech stocks for the long position
- Top 10 Tech stocks for the short position
Package Name: Tech Stocks Forecast
Recommended Positions: Long
Forecast Length: 14 Days (1/10/21 – 1/25/21)
I Know First Average: 9.62%
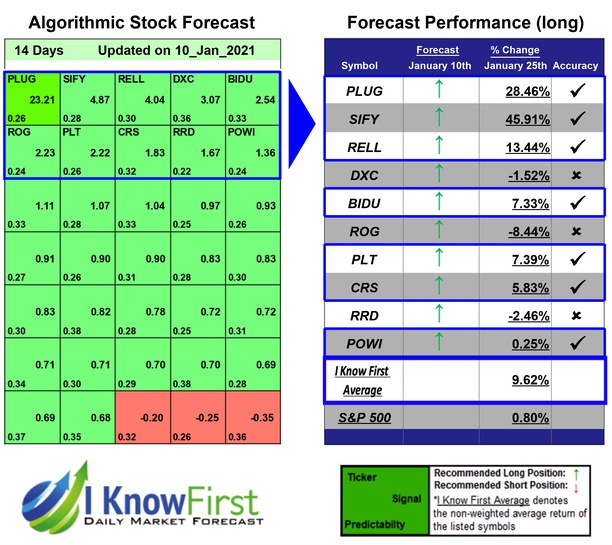

In this 14 Days forecast for the Tech Stocks Forecast Package, there were many high performing trades and the algorithm correctly predicted 7 out 10 trades. SIFY was the highest-earning trade with a return of 45.91% in 14 Days. Additional high returns came from PLUG and RELL, at 28.46% and 13.44% respectively. The Tech Stocks Forecast package had an overall average return of 9.62%, providing investors with a premium of 8.82% over the S&P 500’s return of 0.8%.
Sify Technologies Limited provides integrated information and communications technology solutions and services in India and internationally. Sify Technologies Limited was founded in 1995 and is headquartered in Chennai, India.
Algorithmic traders utilize these daily forecasts by the I Know First market prediction system as a tool to enhance portfolio performance, verify their own analysis and act on market opportunities faster. This forecast was sent to current I Know First subscribers.
How to interpret this diagram
Algorithmic Stock Forecast: The table on the left is a stock forecast produced by I Know First’s algorithm. Each day, subscribers receive forecasts for six different time horizons. Note that the top 10 stocks in the 1-month forecast may be different than those in the 1-year forecast. In the included table, only the relevant stocks have been included. The boxes are arranged according to their respective signal and predictability values (see below for detailed definitions). A green box represents a positive forecast, suggesting a long position, while a red represents a negative forecast, suggesting a short position.
Please note-for trading decisions use the most recent forecast. Get today’s forecast and Top stock picks.


