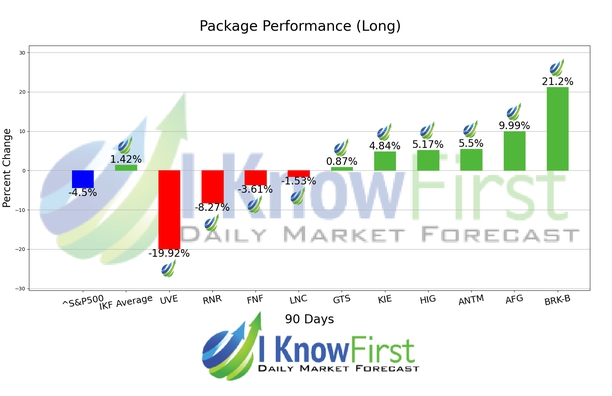
Best Insurance Stocks Based on Big Data Analytics: Returns up to 21.2% in 3 Months

insurance Package Name: Insurance Companies Forecast
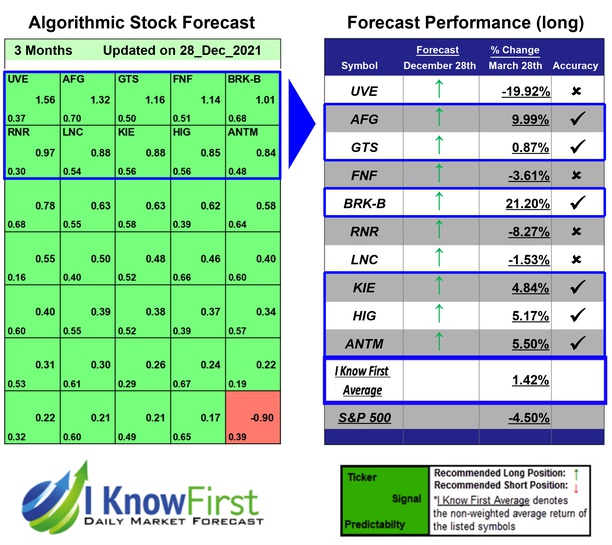
Recommended Positions: Long
Forecast Length: 3 Months (12/28/21 - 3/28/22)
I Know First Average: 1.42%

Read The Full Forecast

Best Insurance Stocks Best Insurance Stocks chart

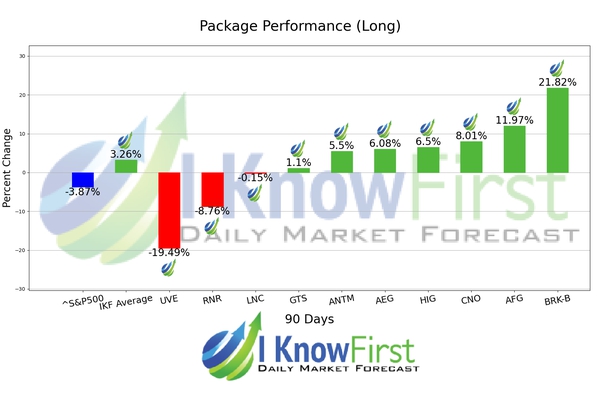
Insurance Stocks Based on Deep-Learning: Returns up to 21.82% in 3 Months

insurance Package Name: Insurance Companies Forecast
Recommended Positions: Long
Forecast Length: 3 Months (12/26/21 - 3/27/22)
I Know First Average: 3.26%

Read The Full Forecast

Insurance Stocks Insurance Stocks chart

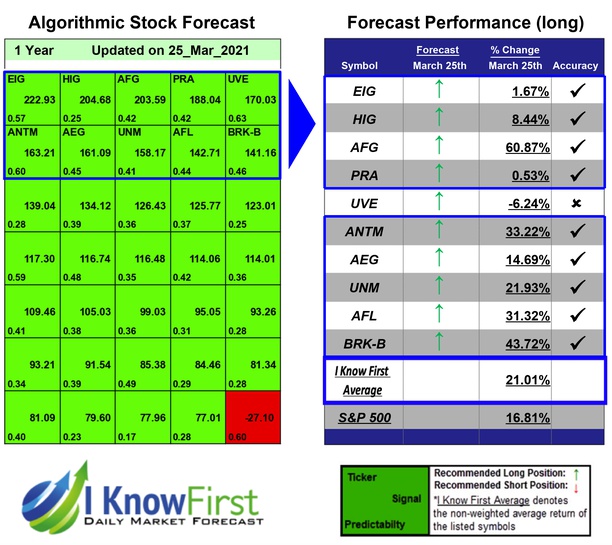
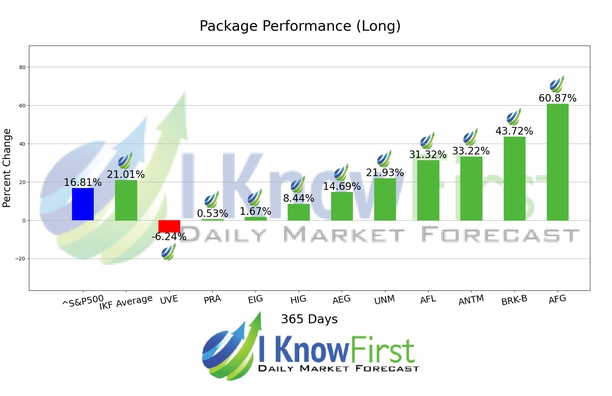
Insurance Stocks Based on Pattern Recognition: Returns up to 60.87% in 1 Year

insurance Package Name: Insurance Companies Forecast
Recommended Positions: Long
Forecast Length: 1 Year (3/25/21 - 3/25/22)
I Know First Average: 21.01%

Read The Full Forecast

Insurance Stocks Insurance Stocks chart

Insurance Stocks Based on AI: Returns up to 11.12% in 3 Months

insurance Package Name: Insurance Companies Forecast
Recommended Positions: Long
Forecast Length: 3 Months (12/21/21 - 3/21/22)
I Know First Average: 1.77%

Read The Full Forecast

Insurance Stocks Insurance Stocks chart

Insurance Stocks Based on Genetic Algorithms: Returns up to 14.26% in 14 Days

insurance Package Name: Insurance Companies Forecast
Recommended Positions: Short
Forecast Length: 14 Days (3/1/22 - 3/15/22)
I Know First Average: 5.2%

Read The Full Forecast

Insurance Stocks Insurance Stocks chart

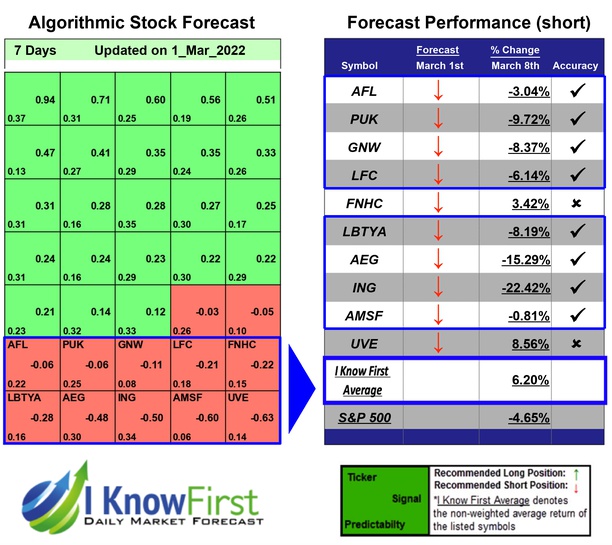
Insurance Stocks Based on AI: Returns up to 22.42% in 7 Days

insurance Package Name: Insurance Companies Forecast
Recommended Positions: Short
Forecast Length: 7 Days (3/1/22 - 3/8/22)
I Know First Average: 6.2%

Read The Full Forecast

Insurance Stocks Insurance Stocks chart

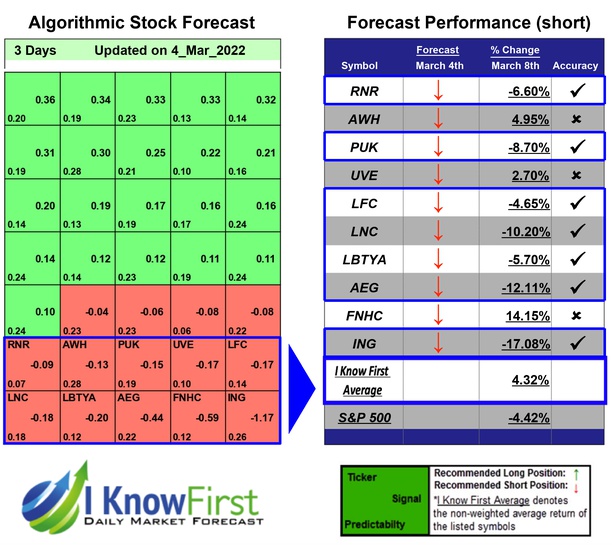
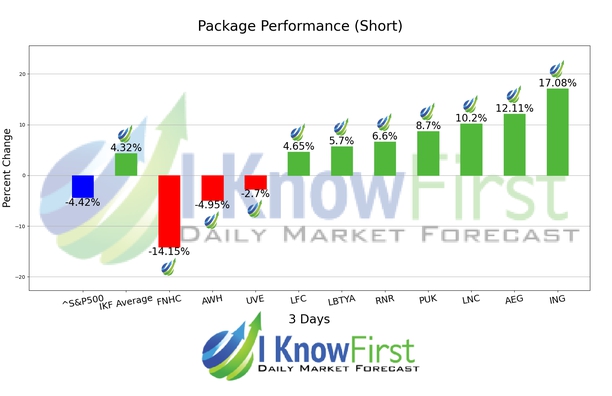
Insurance Stocks Based on AI: Returns up to 17.08% in 3 Days

insurance Package Name: Insurance Companies Forecast
Recommended Positions: Short
Forecast Length: 3 Days (3/4/22 - 3/8/22)
I Know First Average: 4.32%

Read The Full Forecast

Insurance Stocks Insurance Stocks chart