Australian Stocks Based on Machine Learning: Returns up to 8.92% in 3 Days
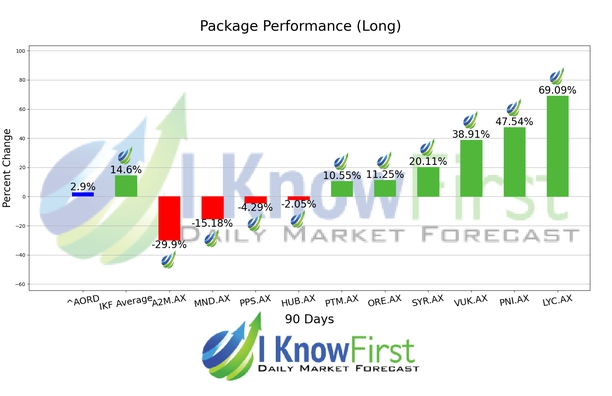
Package Name: By Country - Australian Stocks
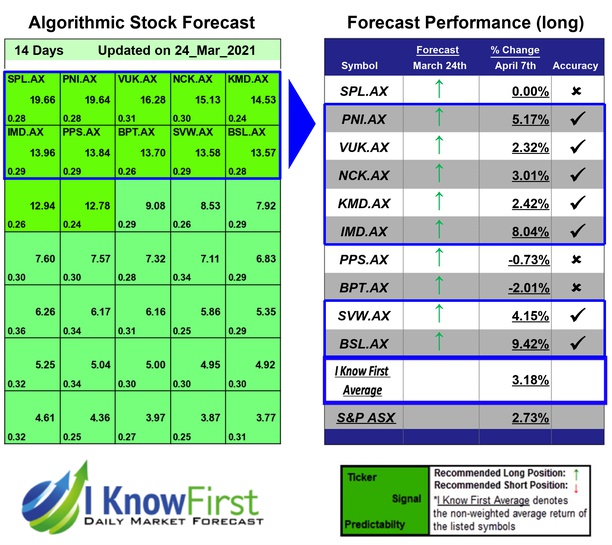
Recommended Positions: Long
Forecast Length: 3 Days (4/2/21 - 4/7/21)
I Know First Average: 2.9%


Recommended Positions: Long
Forecast Length: 3 Days (4/2/21 - 4/7/21)
I Know First Average: 2.9%
Read The Full Forecast