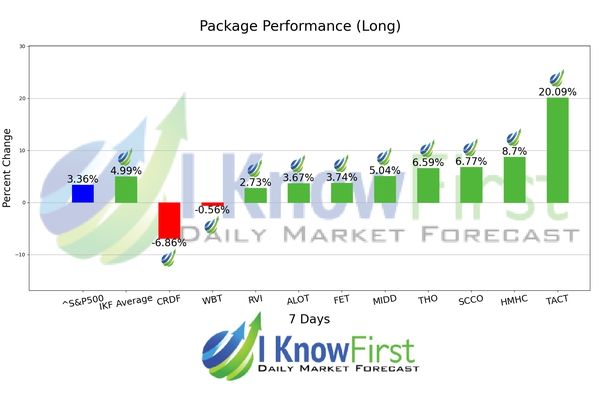
Halal Stocks List Based on Genetic Algorithms: Returns up to 20.09% in 7 Days

Package Name: Halal Stocks
Recommended Positions: Long
Forecast Length: 7 Days (7/20/21 - 7/27/21)
I Know First Average: 4.99%

Read The Full Forecast

Halal Stocks List Halal Stocks List chart

Small Cap Stocks To Buy Based on Algorithmic Trading: Returns up to 120.66% in 3 Months

Package Name: Small Cap Forecast
Recommended Positions: Long
Forecast Length: 3 Months (4/25/21 - 7/26/21)
I Know First Average: 12.77%

Read The Full Forecast

Small Cap Stocks To Buy Small Cap Stocks To Buy chart

Halal Stocks List Based on Genetic Algorithms: Returns up to 120.66% in 3 Months

Package Name: Halal Stocks
Recommended Positions: Long
Forecast Length: 3 Months (4/25/21 - 7/26/21)
I Know First Average: 9.17%

Read The Full Forecast

Halal Stocks List Halal Stocks List chart

Best Small Cap Stocks Based on Data Mining: Returns up to 118.14% in 3 Months

Package Name: Small Cap Forecast
Recommended Positions: Long
Forecast Length: 3 Months (4/25/21 - 7/25/21)
I Know First Average: 12.63%

Read The Full Forecast

Best Small Cap Stocks Best Small Cap Stocks chart

Stock Market Outlook Based on Big Data Analytics: Returns up to 59.25% in 3 Months

fundamentals Package Name: Fundamental - Low P/E Stocks
Recommended Positions: Long
Forecast Length: 3 Months (4/23/21 - 7/24/21)
I Know First Average: 8.17%

Read The Full Forecast

Stock Market Outlook Stock Market Outlook chart

Stock Market Outlook Based on Pattern Recognition: Returns up to 329.39% in 14 Days

fundamentals Package Name: Fundamental - Low Price-to-Book ratio Stocks
Recommended Positions: Long
Forecast Length: 14 Days (7/7/21 - 7/21/21)
I Know First Average: 30.63%

Read The Full Forecast

Stock Market Outlook Stock Market Outlook chart

Stocks Under 10 Based on AI: Returns up to 174.06% in 7 Days

Package Name: Stocks Under $10
Recommended Positions: Long
Forecast Length: 7 Days (7/14/21 - 7/21/21)
I Know First Average: 19.82%

Read The Full Forecast

Stocks Under 10 Stocks Under 10 chart