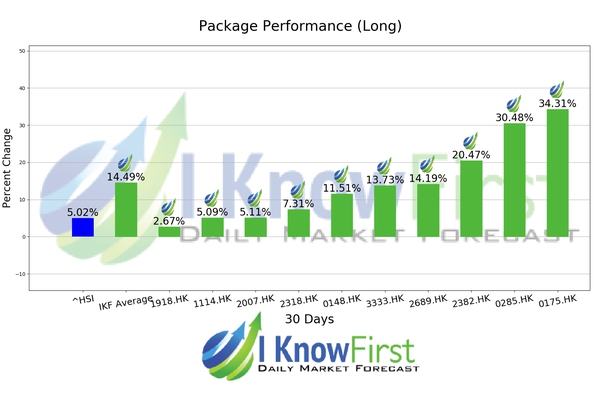
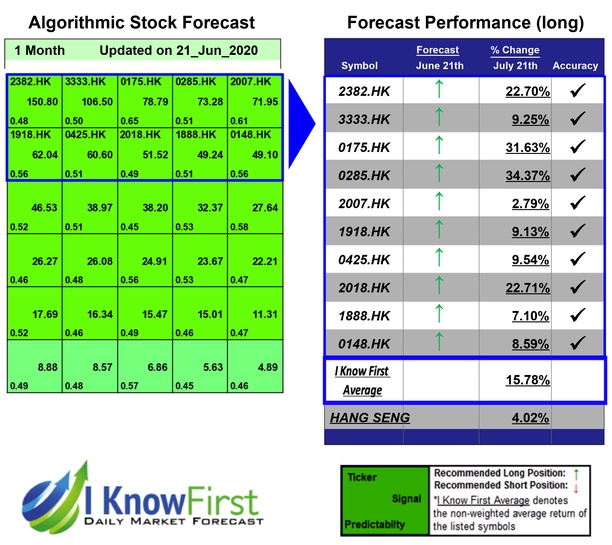
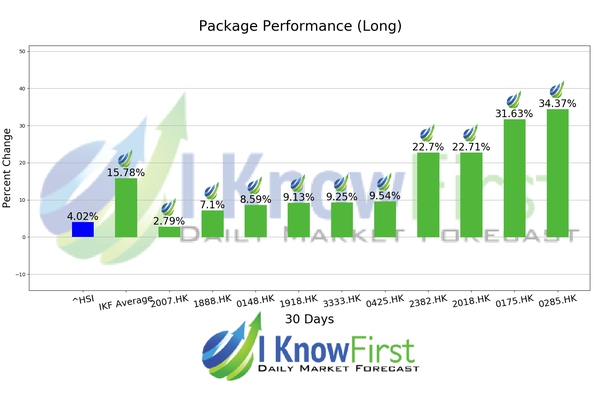
Hong Kong Stocks Based on AI: Returns up to 34.37% in 1 Month

Package Name: By Country – Hong Kong Stocks
Recommended Positions: Long
Forecast Length: 1 Month (6/21/2020 - 7/21/2020)
I Know First Average: 15.78%

Read The Full Forecast

Hong Kong Stocks Hong Kong Stocks chart

Hong Kong Stocks Based on Deep Learning: Returns up to 27.94% in 1 Month

Package Name: By Country – Hong Kong Stocks
Recommended Positions: Long
Forecast Length: 1 Month (6/19/2020 - 7/20/2020)
I Know First Average: 13.48%

Read The Full Forecast

Hong Kong Stocks Hong Kong Stocks chart

Hong Kong Stocks Based on Stock Prediction Algorithm: Returns up to 34.31% in 1 Month

Package Name: By Country – Hong Kong Stocks
Recommended Positions: Long
Forecast Length: 1 Month (6/16/2020 - 7/16/2020)
I Know First Average: 14.49%

Read The Full Forecast

Hong Kong Stocks Hong Kong Stocks chart

Hong Kong Stocks Based on Genetic Algorithms: Returns up to 47.01% in 1 Month

Package Name: By Country – Hong Kong Stocks
Recommended Positions: Long
Forecast Length: 1 Month (6/15/2020 - 7/15/2020)
I Know First Average: 17.94%

Read The Full Forecast

Hong Kong Stocks Hong Kong Stocks chart

Hong Kong Stocks Based on a Self-learning Algorithm: Returns up to 45.08% in 14 Days

Package Name: By Country – Hong Kong Stocks
Recommended Positions: Long
Forecast Length: 14 Days (7/1/2020 - 7/15/2020)
I Know First Average: 14.9%

Read The Full Forecast

Hong Kong Stocks Hong Kong Stocks chart

Hong Kong Stocks Based on Algorithmic Trading: Returns up to 37.76% in 14 Days

Package Name: By Country – Hong Kong Stocks
Recommended Positions: Long
Forecast Length: 14 Days (6/24/2020 - 7/8/2020)
I Know First Average: 17.87%

Read The Full Forecast

Hong Kong Stocks Hong Kong Stocks chart

Hong Kong Stocks Based on Genetic Algorithms: Returns up to 44.56% in 1 Month

Package Name: By Country – Hong Kong Stocks
Recommended Positions: Long
Forecast Length: 1 Month (6/7/2020 - 7/8/2020)
I Know First Average: 18.71%

Read The Full Forecast

Hong Kong Stocks Hong Kong Stocks chart