
Strong Buy Stocks Based on Deep Learning: Returns up to 10.09% in 14 Days
Strong Buy Stocks
This forecast is part of the Top 10 Stocks Package, as one of I Know First’s systematic trading tools. The full package includes a daily prediction for a total of 20 strong buy stocks with bullish and bearish signals:
- Top 10 stocks pick for the long position
- Top 10 stocks pick for the short position
![]()
![]()
Package Name: Stock Forecast & S&P500 Forecast
Recommended Positions: Long
Forecast Length: 14 Days (3/3/21 – 3/17/21)
I Know First Average: 3.26%
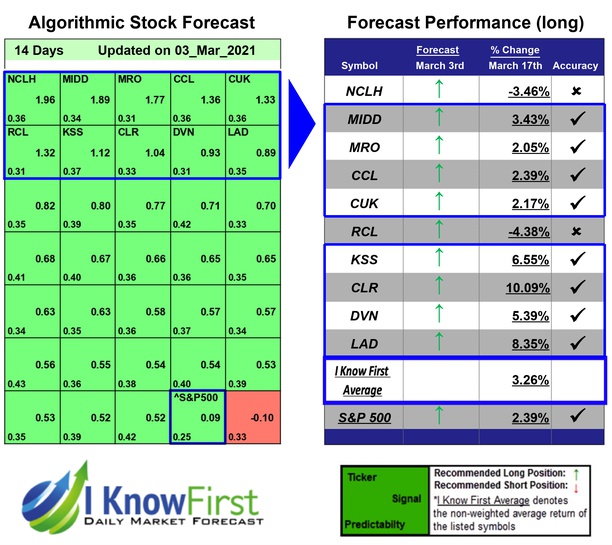
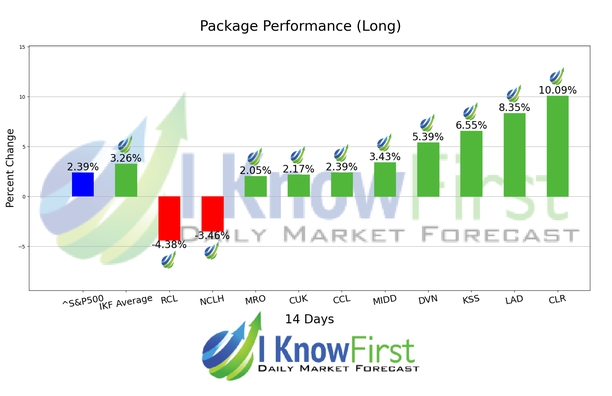
This Stock Forecast & S&P500 Forecast Package forecast had correctly predicted 8 out of 10 stock movements. The highest trade return came from CLR, at 10.09%. LAD and KSS also performed well for this time horizon with returns of 8.35% and 6.55%, respectively. The package saw an overall yield of 3.26% versus the S&P 500’s return of 2.39% implying a market premium of 0.87%.
Continental Resources, Inc. (CLR) is an independent crude oil and natural gas exploration and production company with properties in the North, South and East regions of the United States. The North region consists of properties north of Kansas and west of the Mississippi River and includes North Dakota Bakken, Montana Bakken and the Red River units.
Algorithmic traders utilize these daily forecasts by the I Know First market prediction system as a tool to enhance portfolio performance, verify their own analysis and act on market opportunities faster. This forecast was sent to current I Know First subscribers.
How to interpret this diagram
Algorithmic Stock Forecast: The table on the left is a stock forecast produced by I Know First’s algorithm. Each day, subscribers receive forecasts for six different time horizons. Note that the top 10 stocks in the 1-month forecast may be different than those in the 1-year forecast. In the included table, only the relevant stocks have been included. The boxes are arranged according to their respective signal and predictability values (see below for detailed definitions). A green box represents a positive forecast, suggesting a long position, while a red represents a negative forecast, suggesting a short position.
Please note-for trading decisions use the most recent forecast. Get today’s forecast and Top stock picks.


