
Stocks With High Implied Volatility Based on Predictive Analytics: Returns up to 126.06% in 1 Month
Stocks With High Implied Volatility
These stocks with high implied volatility are part of the Implied Volatility Options Package is designed for investors and analysts who need implied volatility predictions for options trading. It includes 20 stock options with bullish and bearish signals for implied volatility and indicates the best options to buy and sell:
- Implied volatility Top 10 call options
- Implied volatility Top 10 put options

Package Name: Implied Volatility Options
Recommended Positions: Long
Forecast Length: 1 Month (11/8/2020 – 12/9/2020)
I Know First Average: 43.3%
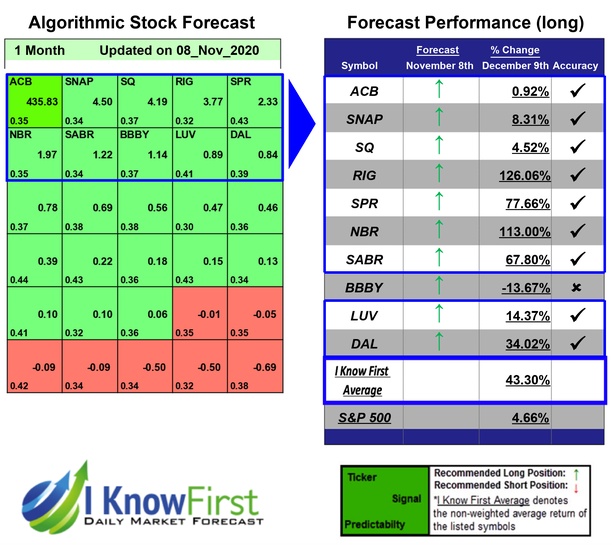
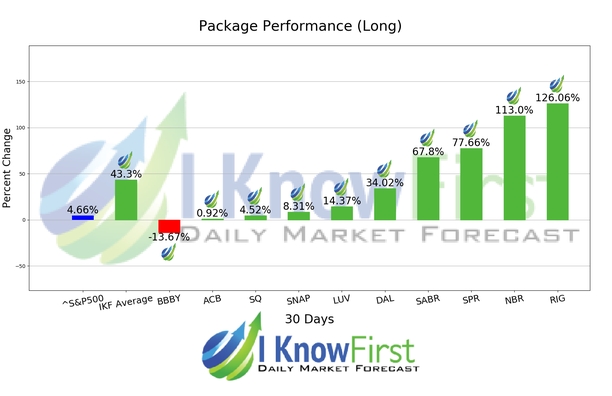
During the 1 Month forecasted period several picks in the Implied Volatility Options Package saw significant returns. The algorithm had correctly predicted 9 out 10 returns. RIG was our best stock pick this week a return of 126.06%. NBR and SPR followed with returns of 113.0% and 77.66% for the 1 Month period. The Implied Volatility Options package had an overall average return of 43.3%, providing investors with a premium of 38.64% over the S&P 500’s return of 4.66%.
Transocean Ltd. (RIG), together with its subsidiaries, provides offshore contract drilling services for oil and gas wells worldwide. The company primarily offers deepwater and harsh environment drilling services. As of February 11, 2016, it owned or had partial ownership interests in, and operated 61 mobile offshore drilling units that consist of 28 ultra-deepwater floaters, 7 harsh environment floaters, 5 deepwater floaters, 11 midwater floaters, and 10 high-specification jackups. The company serves government-controlled oil companies and independent oil companies. Transocean Ltd. (RIG) was founded in 1953 and is based in Vernier, Switzerland.
Algorithmic traders utilize these daily forecasts by the I Know First market prediction system as a tool to enhance portfolio performance, verify their own analysis and act on market opportunities faster. This forecast was sent to current I Know First subscribers.
How to interpret this diagram
Algorithmic Stock Forecast: The table on the left is a stock forecast produced by I Know First’s algorithm. Each day, subscribers receive forecasts for six different time horizons. Note that the top 10 stocks in the 1-month forecast may be different than those in the 1-year forecast. In the included table, only the relevant stocks have been included. The boxes are arranged according to their respective signal and predictability values (see below for detailed definitions). A green box represents a positive forecast, suggesting a long position, while a red represents a negative forecast, suggesting a short position.
Please note-for trading decisions use the most recent forecast. Get today’s forecast and Top stock picks.


