
Stocks With High Implied Volatility Based on Big Data Analytics: Returns up to 81.07% in 1 Month
Stocks With High Implied Volatility
The Implied Volatility Options Package is designed for investors and analysts who need implied volatility predictions for options trading. It includes 20 stocks with high implied volatility and indicates the best options to buy and sell:
- Implied volatility Top 10 call options
- Implied volatility Top 10 put options

Package Name: Implied Volatility Options
Recommended Positions: Long
Forecast Length: 1 Month (11/1/2020 – 12/2/2020)
I Know First Average: 26.6%
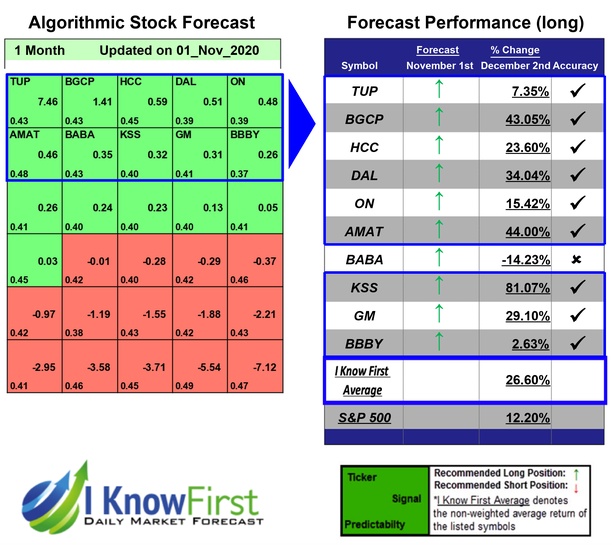
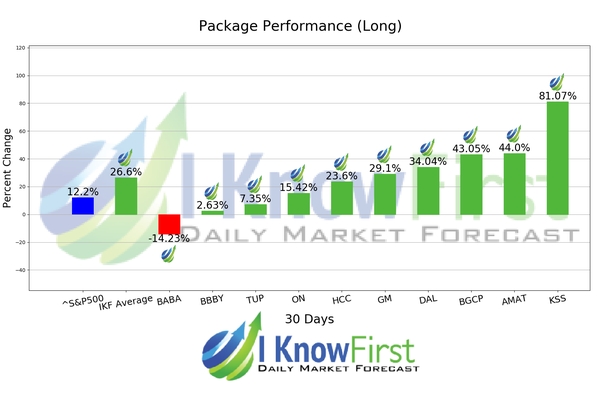
In this 1 Month forecast for the Implied Volatility Options Package, there were many high performing trades and the algorithm correctly predicted 9 out 10 trades. The greatest return came from KSS at 81.07%. The suggested trades for AMAT and BGCP also had notable 1 Month yields of 44.0% and 43.05%, respectively. The Implied Volatility Options package had an overall average return of 26.6%, providing investors with a premium of 14.40% over the S&P 500’s return of 12.2%.
Kohl’s Corporation operates department stores in the United States. It offers private label, exclusive, and national brand apparel, footwear, accessories, beauty, and home products to children, men, and women customers. The company also sells its products online through Website Kohls.com. As of January 30, 2016, it operated 1,164 department stores in 49 states. Kohl’s Corporation was founded in 1962 and is headquartered in Menomonee Falls, Wisconsin.
Algorithmic traders utilize these daily forecasts by the I Know First market prediction system as a tool to enhance portfolio performance, verify their own analysis and act on market opportunities faster. This forecast was sent to current I Know First subscribers.
How to interpret this diagram
Algorithmic Stock Forecast: The table on the left is a stock forecast produced by I Know First’s algorithm. Each day, subscribers receive forecasts for six different time horizons. Note that the top 10 stocks in the 1-month forecast may be different than those in the 1-year forecast. In the included table, only the relevant stocks have been included. The boxes are arranged according to their respective signal and predictability values (see below for detailed definitions). A green box represents a positive forecast, suggesting a long position, while a red represents a negative forecast, suggesting a short position.
Please note-for trading decisions use the most recent forecast. Get today’s forecast and Top stock picks.


