
Stocks Under 50 Dollars Based on a Self-learning Algorithm: Returns up to 147.21% in 3 Months
Stocks Under 50 Dollars
This forecast is part of the Stocks Under 50 Dollars Package, as one of I Know First’s forecast services. The full package includes daily stock predictions for a total of 20 Stocks Under 50 Dollars stocks with bullish and bearish signals:
- Top 10 stocks for the long position
- Top 10 stocks for the short position
Package Name: Stocks Under $50
Recommended Positions: Long
Forecast Length: 3 Months (5/10/2020 – 8/10/2020)
I Know First Average: 38.29%
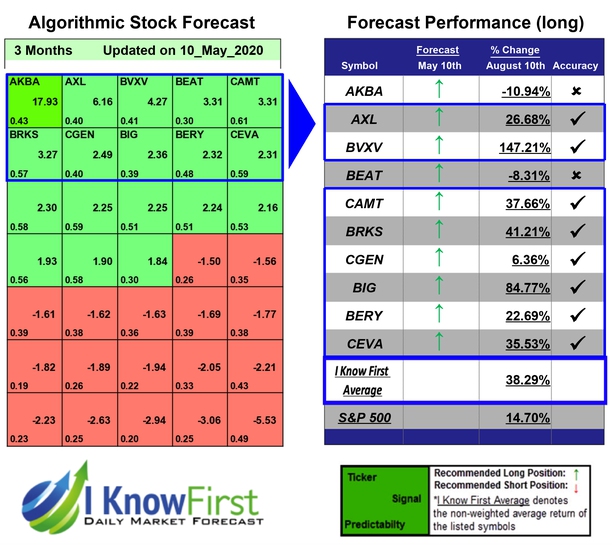
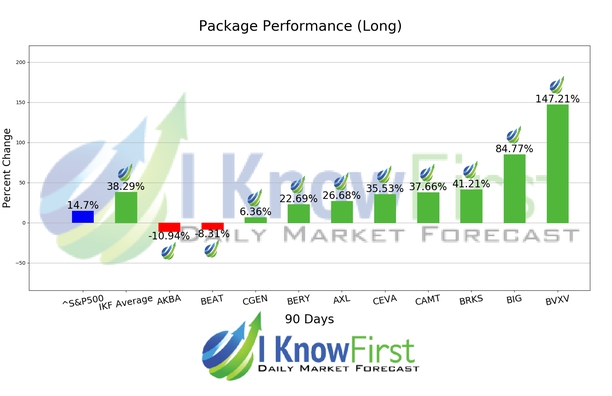
I Know First’s State of the Art Algorithm accurately forecasted 8 out of 10 trades in this Stocks Under $50 Package for the 3 Months time period. The prediction with the highest return was BVXV, at 147.21%. BIG and BRKS also performed well for this time horizon with returns of 84.77% and 41.21%, respectively. The package saw an overall yield of 38.29% versus the S&P 500’s return of 14.7% implying a market premium of 23.59%.
BiondVax Pharmaceuticals Ltd., a clinical stage biopharmaceutical company, focuses on developing and commercializing immunomodulation therapies for infectious diseases primarily in Israel. Its product candidate is M-001, a synthetic peptide-based protein, which has completed Phase II clinical trials that is used for treating seasonal and pandemic strains of the influenza virus. The company was founded in 2003 and is headquartered in Ness Ziona, Israel.
Algorithmic traders utilize these daily forecasts by the I Know First market prediction system as a tool to enhance portfolio performance, verify their own analysis and act on market opportunities faster. This forecast was sent to current I Know First subscribers.
How to interpret this diagram
Algorithmic Stock Forecast: The table on the left is a stock forecast produced by I Know First’s algorithm. Each day, subscribers receive forecasts for six different time horizons. Note that the top 10 stocks in the 1-month forecast may be different than those in the 1-year forecast. In the included table, only the relevant stocks have been included. The boxes are arranged according to their respective signal and predictability values (see below for detailed definitions). A green box represents a positive forecast, suggesting a long position, while a red represents a negative forecast, suggesting a short position.
Please note-for trading decisions use the most recent forecast. Get today’s forecast and Top stock picks.


