
Stock Screener Based on Predictive Analytics: Returns up to 491.95% in 1 Year
Stock Screener
The Fundamental Package includes our algorithmic stock screener for stocks screened by fundamental criteria. Our algorithms help you find best opportunities for both long and short positions for the stocks within each fundamental screen. The stocks are selected according to five basic valuation categories:
- P/E (price to earnings ratio)
- PEG (price/earnings to growth ratio)
- price-to-book ratio
- price-to-sales ratio
- short ratio

Package Name: Fundamental – High Price-to-Sales ratio Stocks
Recommended Positions: Long
Forecast Length: 1 Year (7/19/2019 – 7/19/2020)
I Know First Average: 63.34%
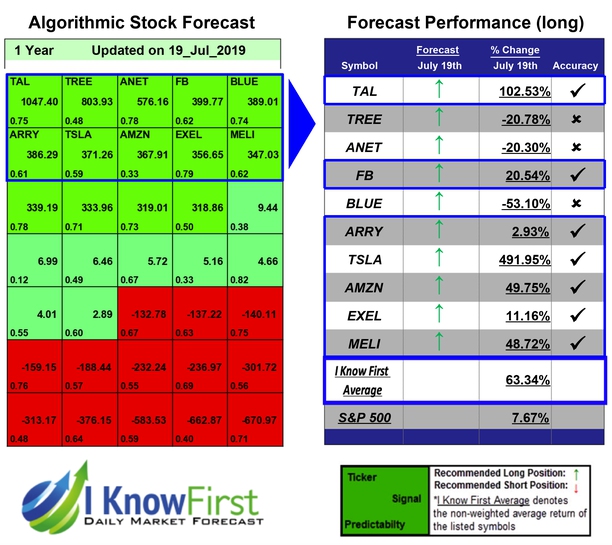
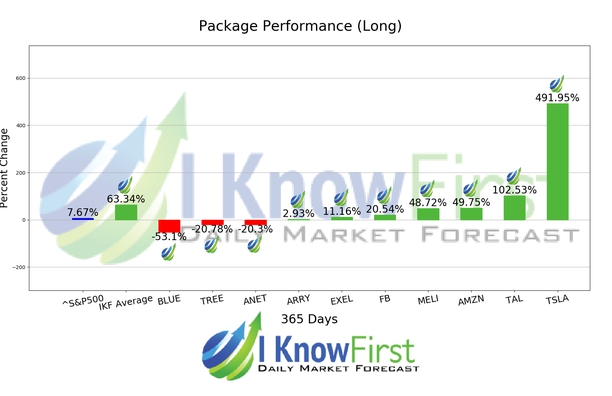
7 out of 10 stock prices in this forecast for the Fundamental – High Price-to-Sales ratio Stocks Package moved as predicted by the algorithm. The top-performing prediction in this forecast was TSLA, which registered a return of 491.95%. TAL, and AMZN had notable returns of 102.53% and 49.75%. This algorithmic forecast package presented an overall return of 63.34% versus S&P 500’s performance of 7.67% providing a market premium of 55.67%.
Tesla, Inc., formerly Tesla Motors, Inc., incorporated on July 1, 2003, designs, develops, manufactures and sells fully electric vehicles, and energy storage systems, as well as installs, operates and maintains solar and energy storage products. The Company operates through two segments: automotive, and energy generation and storage. The automotive segment includes the design, development, manufacturing, and sales of electric vehicles. The energy generation and storage segment includes the design, manufacture, installation, and sale or lease of stationary energy storage products and solar energy systems to residential and commercial customers, or sale of electricity generated by its solar energy systems to customers.
Algorithmic traders utilize these daily forecasts by the I Know First market prediction system as a tool to enhance portfolio performance, verify their own analysis and act on market opportunities faster. This forecast was sent to current I Know First subscribers.
How to interpret this diagram
Algorithmic Stock Forecast: The table on the left is a stock forecast produced by I Know First’s algorithm. Each day, subscribers receive forecasts for six different time horizons. Note that the top 10 stocks in the 1-month forecast may be different than those in the 1-year forecast. In the included table, only the relevant stocks have been included. The boxes are arranged according to their respective signal and predictability values (see below for detailed definitions). A green box represents a positive forecast, suggesting a long position, while a red represents a negative forecast, suggesting a short position.
Please note-for trading decisions use the most recent forecast. Get today’s forecast and Top stock picks.


