
Stock Screener Based on Deep Learning: Returns up to 119.34% in 1 Year
Stock Screener
The Fundamental Package includes our algorithmic stock screener forecasts for stocks screened by fundamental criteria. Our algorithms help you find the best opportunities for both long and short positions for the stocks within each fundamental screen. The stocks are selected according to five basic valuation categories:
- P/E (price to earnings ratio)
- PEG (price/earnings to growth ratio)
- price-to-book ratio
- price-to-sales ratio
- short ratio

Package Name: Fundamental – High P/E Stocks
Recommended Positions: Long
Forecast Length: 1 Year (3/2/21 – 3/2/22)
I Know First Average: 27.34%
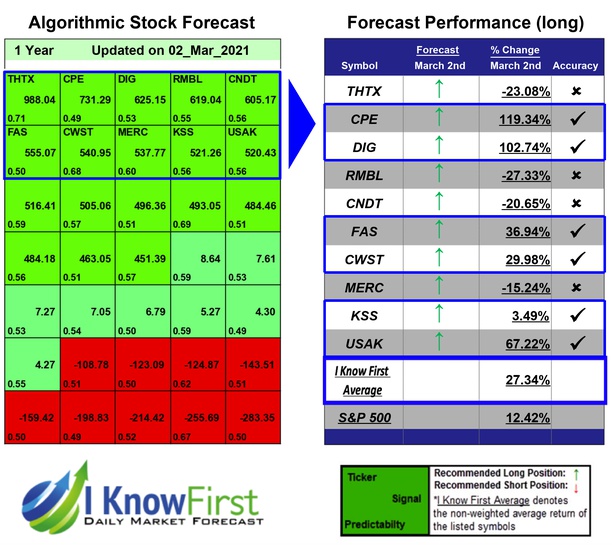

In this 1 Year forecast for the Fundamental – High P/E Stocks Package, there were many high performing trades and the algorithm correctly predicted 6 out of 10 trades. The top performing prediction from this package was CPE with a return of 119.34%. DIG, and USAK had notable returns of 102.74% and 67.22%. With these notable trade returns, the package itself registered an average return of 27.34% compared to the S&P 500’s return of 12.42% for the same period.
Callon Petroleum Company (CPE), an independent oil and natural gas company, acquires, explores for, develops, and produces oil and natural gas properties in the Permian Basin in West Texas. As of December 31, 2015, the company estimated net proved reserves totaled 54.3 million barrel of oil equivalent. Callon Petroleum Company (CPE) was founded in 1950 and is headquartered in Natchez, Mississippi.
Algorithmic traders utilize these daily forecasts by the I Know First market prediction system as a tool to enhance portfolio performance, verify their own analysis and act on market opportunities faster. This forecast was sent to current I Know First subscribers.
How to interpret this diagram
Algorithmic Stock Forecast: The table on the left is a stock forecast produced by I Know First’s algorithm. Each day, subscribers receive forecasts for six different time horizons. Note that the top 10 stocks in the 1-month forecast may be different than those in the 1-year forecast. In the included table, only the relevant stocks have been included. The boxes are arranged according to their respective signal and predictability values (see below for detailed definitions). A green box represents a positive forecast, suggesting a long position, while a red represents a negative forecast, suggesting a short position.
Please note-for trading decisions use the most recent forecast. Get today’s forecast and Top stock picks.


