
Stock Screener Based on Data Mining: Returns up to 1528.23% in 1 Year
Stock Screener
The Fundamental Package includes our algorithmic stock screener for stocks screened by fundamental criteria. Our algorithms help you find best opportunities for both long and short positions for the stocks within each fundamental screen. The stocks are selected according to five basic valuation categories:
- P/E (price to earnings ratio)
- PEG (price/earnings to growth ratio)
- price-to-book ratio
- price-to-sales ratio
- short ratio

Package Name: Fundamental – Low P/E Stocks
Recommended Positions: Long
Forecast Length: 1 Year (6/26/20 – 6/27/21)
I Know First Average: 208.06%

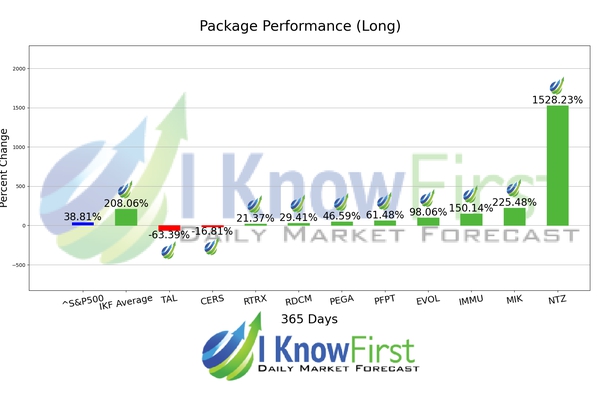
8 out of 10 stock prices in this forecast for the Fundamental – Low P/E Stocks Package moved as predicted by the algorithm. NTZ was our best stock pick this week a return of 1528.23%. Further notable returns came from MIK and IMMU at 225.48% and 150.14%, respectively. This algorithmic forecast package presented an overall return of 208.06% versus S&P 500’s performance of 38.81% providing a market premium of 169.25%.
Natuzzi S.p.A. designs, manufactures, and markets leather and fabric upholstered furniture worldwide. Its products primarily include stationary furniture (sofas, loveseats, and armchairs), sectional furniture, motion furniture, sofa beds, recliners and massage chairs, and living room, beds, bed linens, and bedroom furnishings and accessories. The company sells its products primarily under the Natuzzi Italia, Natuzzi Editions/Leather Editions, Natuzzi Re-vive, and Softaly brand names. Natuzzi S.p.A. sells its Natuzzi branded furniture primarily through franchised Divani & Divani by Natuzzi, and Natuzzi Italia stores. As of March 31, 2016, it had 182 Natuzzi Italia stores, 80 Divani & Divani by Natuzzi stores, and 9 Natuzzi Italia concessions, as well as 314 Natuzzi Italia galleries. The company was founded in 1959 and is headquartered in Santeramo in Colle, Italy.
Algorithmic traders utilize these daily forecasts by the I Know First market prediction system as a tool to enhance portfolio performance, verify their own analysis and act on market opportunities faster. This forecast was sent to current I Know First subscribers.
How to interpret this diagram
Algorithmic Stock Forecast: The table on the left is a stock forecast produced by I Know First’s algorithm. Each day, subscribers receive forecasts for six different time horizons. Note that the top 10 stocks in the 1-month forecast may be different than those in the 1-year forecast. In the included table, only the relevant stocks have been included. The boxes are arranged according to their respective signal and predictability values (see below for detailed definitions). A green box represents a positive forecast, suggesting a long position, while a red represents a negative forecast, suggesting a short position.
Please note-for trading decisions use the most recent forecast. Get today’s forecast and Top stock picks.


