
Stock Screener Based on Algorithmic Trading: Returns up to 758.54% in 1 Year
Stock Screener
The Fundamental Package includes our algorithmic stock screener for stocks screened by fundamental criteria. Our algorithms help you find best opportunities for both long and short positions for the stocks within each fundamental screen. The stocks are selected according to five basic valuation categories:
- P/E (price to earnings ratio)
- PEG (price/earnings to growth ratio)
- price-to-book ratio
- price-to-sales ratio
- short ratio

Package Name: Fundamental – Low P/E Stocks
Recommended Positions: Long
Forecast Length: 1 Year (1/14/20 – 1/14/21)
I Know First Average: 118.69%
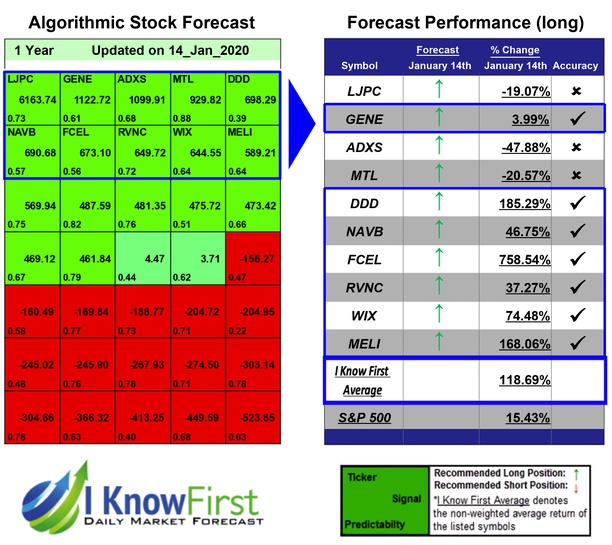
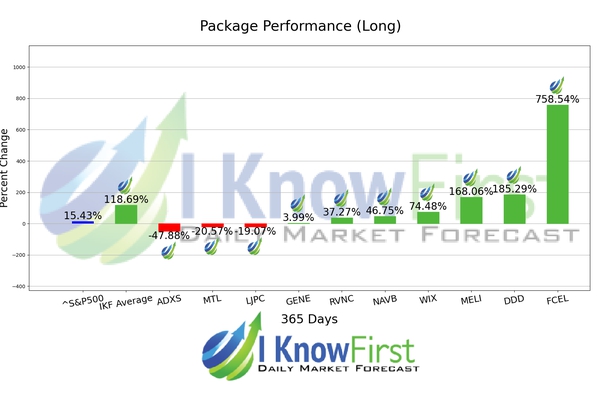
The algorithm correctly predicted 7 out 10 of the suggested trades in the Fundamental – Low P/E Stocks Package for this 1 Year forecast. The top-performing prediction in this forecast was FCEL, which registered a return of 758.54%. The suggested trades for DDD and MELI also had notable 1 Year yields of 185.29% and 168.06%, respectively. With these notable trade returns, the package itself registered an average return of 118.69% compared to the S&P 500’s return of 15.43% for the same period.
FuelCell Energy, Inc., together with its subsidiaries, designs, manufactures, sells, installs, operates, and services stationary fuel cell power plants for distributed power generation.
Algorithmic traders utilize these daily forecasts by the I Know First market prediction system as a tool to enhance portfolio performance, verify their own analysis and act on market opportunities faster. This forecast was sent to current I Know First subscribers.
How to interpret this diagram
Algorithmic Stock Forecast: The table on the left is a stock forecast produced by I Know First’s algorithm. Each day, subscribers receive forecasts for six different time horizons. Note that the top 10 stocks in the 1-month forecast may be different than those in the 1-year forecast. In the included table, only the relevant stocks have been included. The boxes are arranged according to their respective signal and predictability values (see below for detailed definitions). A green box represents a positive forecast, suggesting a long position, while a red represents a negative forecast, suggesting a short position.
Please note-for trading decisions use the most recent forecast. Get today’s forecast and Top stock picks.


