Stock Scanner Based on Data Mining: Returns up to 177.06% in 14 Days
Stock Scanner
Stock Scanner: This forecast is part of the Risk-Conscious Package, as one of I Know First’s equity research solutions. We determine our aggressive stock picks by screening our algorithm daily for higher volatility stocks that present greater opportunities but are also riskier. The full Risk-Conscious Package includes a daily forecast for a total of 40 stocks divided into four main categories:
- Top 10 Aggressive stocks for the long position
- Top 10 Aggressive stocks for the short position
- Top 10 Conservative stocks for the long position
- Top 10 Conservative stocks for the short position

Package Name: Aggressive Stocks Forecast
Recommended Positions: Long
Forecast Length: 14 Days (1/3/23 – 1/17/23)
I Know First Average: 30.4%
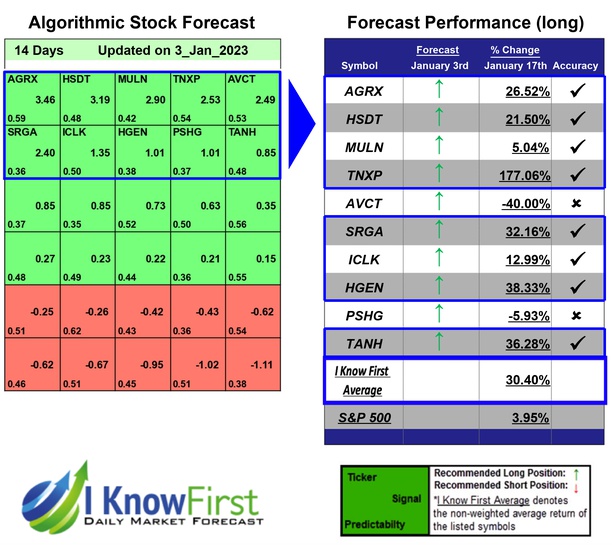
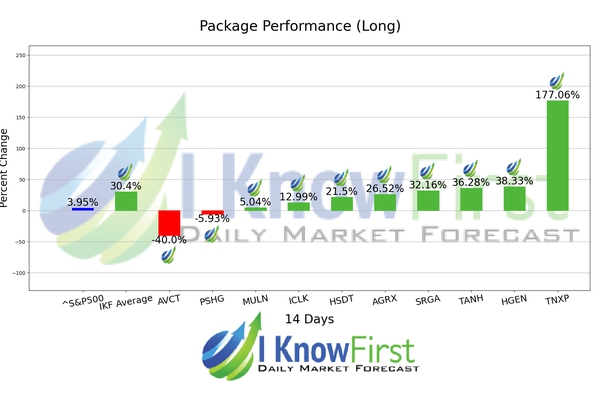
The algorithm correctly predicted 8 out of 10 the suggested trades in the Aggressive Stocks Forecast Package for this 14 Days forecast. TNXP was our best stock pick with a return of 177.06%. HGEN and TANH followed with returns of 38.33% and 36.28% for the 14 Days period. The package had an overall average return of 30.4%, providing investors with a 26.45% premium over the S&P 500’s return of 3.95% during the period.
Algorithmic traders utilize these daily forecasts by the I Know First market prediction system as a tool to enhance portfolio performance, verify their own analysis and act on market opportunities faster. This forecast was sent to current I Know First subscribers.
How to interpret this diagram
Algorithmic Stock Forecast: The table on the left is a stock forecast produced by I Know First’s algorithm. Each day, subscribers receive forecasts for six different time horizons. Note that the top 10 stocks in the 1-month forecast may be different than those in the 1-year forecast. In the included table, only the relevant stocks have been included. The boxes are arranged according to their respective signal and predictability values (see below for detailed definitions). A green box represents a positive forecast, suggesting a long position, while a red represents a negative forecast, suggesting a short position.
Please note-for trading decisions use the most recent forecast. Get today’s forecast and Top stock picks.