
Stock Predictions Based on Data Mining: Returns up to 172.13% in 1 Year
Stock Predictions
An insider is legally permitted to buy and sell shares of the firm – and any subsidiaries – that employs him or her. However, these transactions must be properly registered with the Securities and Exchange Commission (SEC) and are done with advance filings. You can find details of this type of insider trading on the SEC’s EDGAR database. This Stock Predictions algorithmic forecast is for stocks with recently reported insiders’ transactions.

Package Name: Insider Trades
Recommended Positions: Long
Forecast Length: 1 Year (9/21/20 – 9/21/21)
I Know First Average: 70.97%
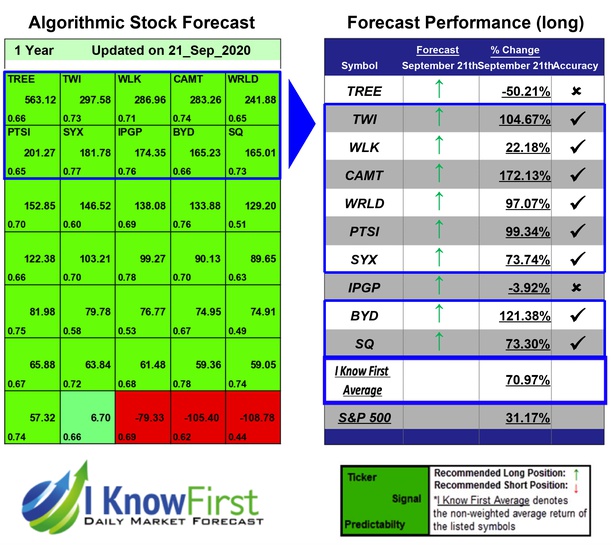
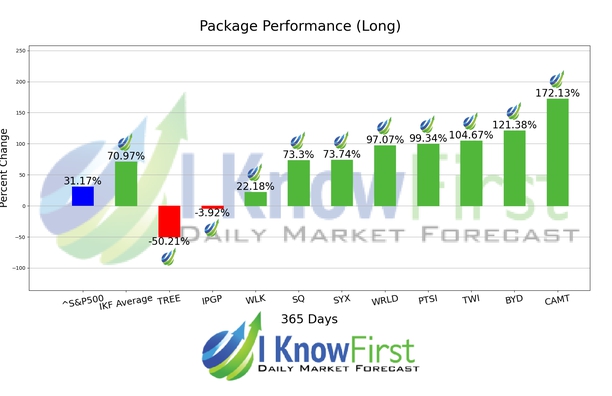
During the 1 Year forecasted period several picks in the Insider Trades Package saw significant returns. The algorithm had correctly predicted 8 out 10 returns. The prediction with the highest return was CAMT, at 172.13%. The suggested trades for BYD and TWI also had notable 1 Year yields of 121.38% and 104.67%, respectively. The overall average return in this Insider Trades package was 70.97%, providing investors with a 39.80% premium over the S&P 500’s return of 31.17% during the same period.
Camtek Ltd. designs, develops, manufactures, and markets automated optical inspection (AOI) systems for semiconductor wafers, integrated circuit substrates, and printed circuit boards (PCBs) in Israel. It operates in two segments, Microelectronics and PCB. The company was founded in 1987 and is headquartered in Migdal HaEmek, Israel.
Algorithmic traders utilize these daily forecasts by the I Know First market prediction system as a tool to enhance portfolio performance, verify their own analysis and act on market opportunities faster. This forecast was sent to current I Know First subscribers.
How to interpret this diagram
Algorithmic Stock Forecast: The table on the left is a stock forecast produced by I Know First’s algorithm. Each day, subscribers receive forecasts for six different time horizons. Note that the top 10 stocks in the 1-month forecast may be different than those in the 1-year forecast. In the included table, only the relevant stocks have been included. The boxes are arranged according to their respective signal and predictability values (see below for detailed definitions). A green box represents a positive forecast, suggesting a long position, while a red represents a negative forecast, suggesting a short position.
Please note-for trading decisions use the most recent forecast. Get today’s forecast and Top stock picks.


