Stock Picking Based on a Self-learning Algorithm: Returns up to 325.35% in 1 Year
Stock Picking
This Stock Picking forecast is designed for investors and analysts who need daily stock market predictions of the best-performing stocks for the whole Basic Industry (see Basic Industry Stocks Package). It includes 20 stocks with bullish and bearish signals and indicates the best basic industry stocks to buy based on artificial intelligence:
- Top 10 Basic Industry stocks for the long position
- Top 10 Basic Industry stocks for the short position

Package Name: Basic Industry Forecast
Recommended Positions: Long
Forecast Length: 1 Year (12/16/20 – 12/16/21)
I Know First Average: 58.62%

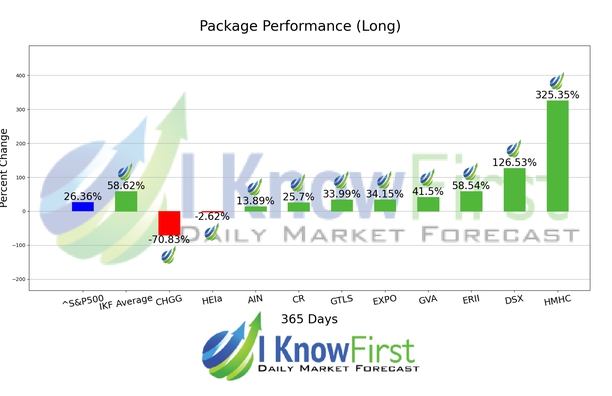
8 out of 10 stock prices in this forecast for the Basic Industry Forecast Package moved as predicted by the algorithm. The top-performing prediction in this forecast was HMHC, which registered a return of 325.35%. DSX and ERII followed with returns of 126.53% and 58.54% for the 1 Year period. The package’s overall average return was 58.62%, providing investors with a 32.26% premium over the S&P 500’s return of 26.36% during the same period.
Houghton Mifflin Harcourt Company (HMH), incorporated on December 23, 2009, is a global learning company, specializing in education solutions across a range of media. The Company operates through two segments: Education and Trade Publishing.
Algorithmic traders utilize these daily forecasts by the I Know First market prediction system as a tool to enhance portfolio performance, verify their own analysis and act on market opportunities faster. This forecast was sent to current I Know First subscribers.
How to interpret this diagram
Algorithmic Stock Forecast: The table on the left is a stock forecast produced by I Know First’s algorithm. Each day, subscribers receive forecasts for six different time horizons. Note that the top 10 stocks in the 1-month forecast may be different than those in the 1-year forecast. In the included table, only the relevant stocks have been included. The boxes are arranged according to their respective signal and predictability values (see below for detailed definitions). A green box represents a positive forecast, suggesting a long position, while a red represents a negative forecast, suggesting a short position.
Please note-for trading decisions use the most recent forecast. Get today’s forecast and Top stock picks.