
Stock Market Outlook Based on Pattern Recognition: Returns up to 53.41% in 3 Days
Stock Market Outlook
The Fundamental Package includes our algorithmic stock market outlook for stocks screened by fundamental criteria. Our algorithms help you find best opportunities for both long and short positions for the stocks within each fundamental screen. The stocks are selected according to five basic valuation categories:
- P/E (price to earnings ratio)
- PEG (price/earnings to growth ratio)
- price-to-book ratio
- price-to-sales ratio
- short ratio

Package Name: Fundamental – High Price-to-Sales ratio Stocks
Recommended Positions: Long
Forecast Length: 3 Days (11/15/2020 – 11/19/2020)
I Know First Average: 17.53%
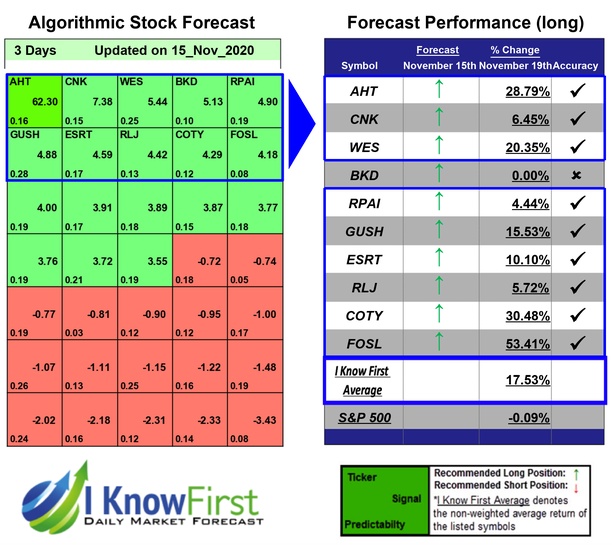

9 out of 10 stock prices in this forecast for the Fundamental – High Price-to-Sales ratio Stocks Package moved as predicted by the algorithm. The highest trade return came from FOSL, at 53.41%. The suggested trades for COTY and AHT also had notable 3 Days yields of 30.48% and 28.79%, respectively. With these notable trade returns, the package itself registered an average return of 17.53% compared to the S&P 500’s return of -0.09% for the same period.
Fossil Group, Inc., together with its subsidiaries, designs, develops, markets, and distributes consumer fashion accessories. The company’s principal products include a line of men’s and women’s fashion watches and jewelry, handbags, small leather goods, belts, sunglasses, and soft accessories. It offers its products under its proprietary brands, such as FOSSIL, MICHELE, MISFIT, RELIC, SKAGEN, and ZODIAC, as well as under the licensed brands, including ADIDAS, ARMANI EXCHANGE, BURBERRY, CHAPS, DIESEL, DKNY, EMPORIO ARMANI, KARL LAGERFELD, KATE SPADE NEW YORK, MARC JACOBS, MICHAEL KORS, and TORY BURCH. The company sells its products through department stores, specialty retail stores, specialty watch and jewelry stores, mass market stores, e-commerce sites, licensed and franchised FOSSIL retail stores, and retail concessions, as well as sells its products on airlines and cruise ships. As of December 31, 2016, it owned and operated 94 retail stores and 129 outlet stores located in the United States, as well as 230 retail stores and 132 outlet stores internationally. The company was formerly known as Fossil, Inc. and changed its name to Fossil Group, Inc. in May 2013. Fossil Group, Inc. was founded in 1984 and is headquartered in Richardson, Texas.
Algorithmic traders utilize these daily forecasts by the I Know First market prediction system as a tool to enhance portfolio performance, verify their own analysis and act on market opportunities faster. This forecast was sent to current I Know First subscribers.
How to interpret this diagram
Algorithmic Stock Forecast: The table on the left is a stock forecast produced by I Know First’s algorithm. Each day, subscribers receive forecasts for six different time horizons. Note that the top 10 stocks in the 1-month forecast may be different than those in the 1-year forecast. In the included table, only the relevant stocks have been included. The boxes are arranged according to their respective signal and predictability values (see below for detailed definitions). A green box represents a positive forecast, suggesting a long position, while a red represents a negative forecast, suggesting a short position.
Please note-for trading decisions use the most recent forecast. Get today’s forecast and Top stock picks.


