Stock Market Indices Forecast Based on Predictive Analytics: Returns up to 141.98% in 14 Days
Stock Market Indices Forecast
This stock market forecast is part of the World Indices Package, as one of I Know First’s quantitative investment solutions. We determine our world indices forecast by screening our database daily using our advanced algorithm. The full World Indices Package includes a daily forecast for a total of 20 indices with bullish and bearish signals:
- Top 10 World Indices for the long position
- Top 10 World Indices for the short position

Package Name: Indices Forecast
Recommended Positions: Long & Short
Forecast Length: 14 Days (3/4/2020 – 3/18/2020)
I Know First Average: 59.14% (Long) & 26.02% (Short)

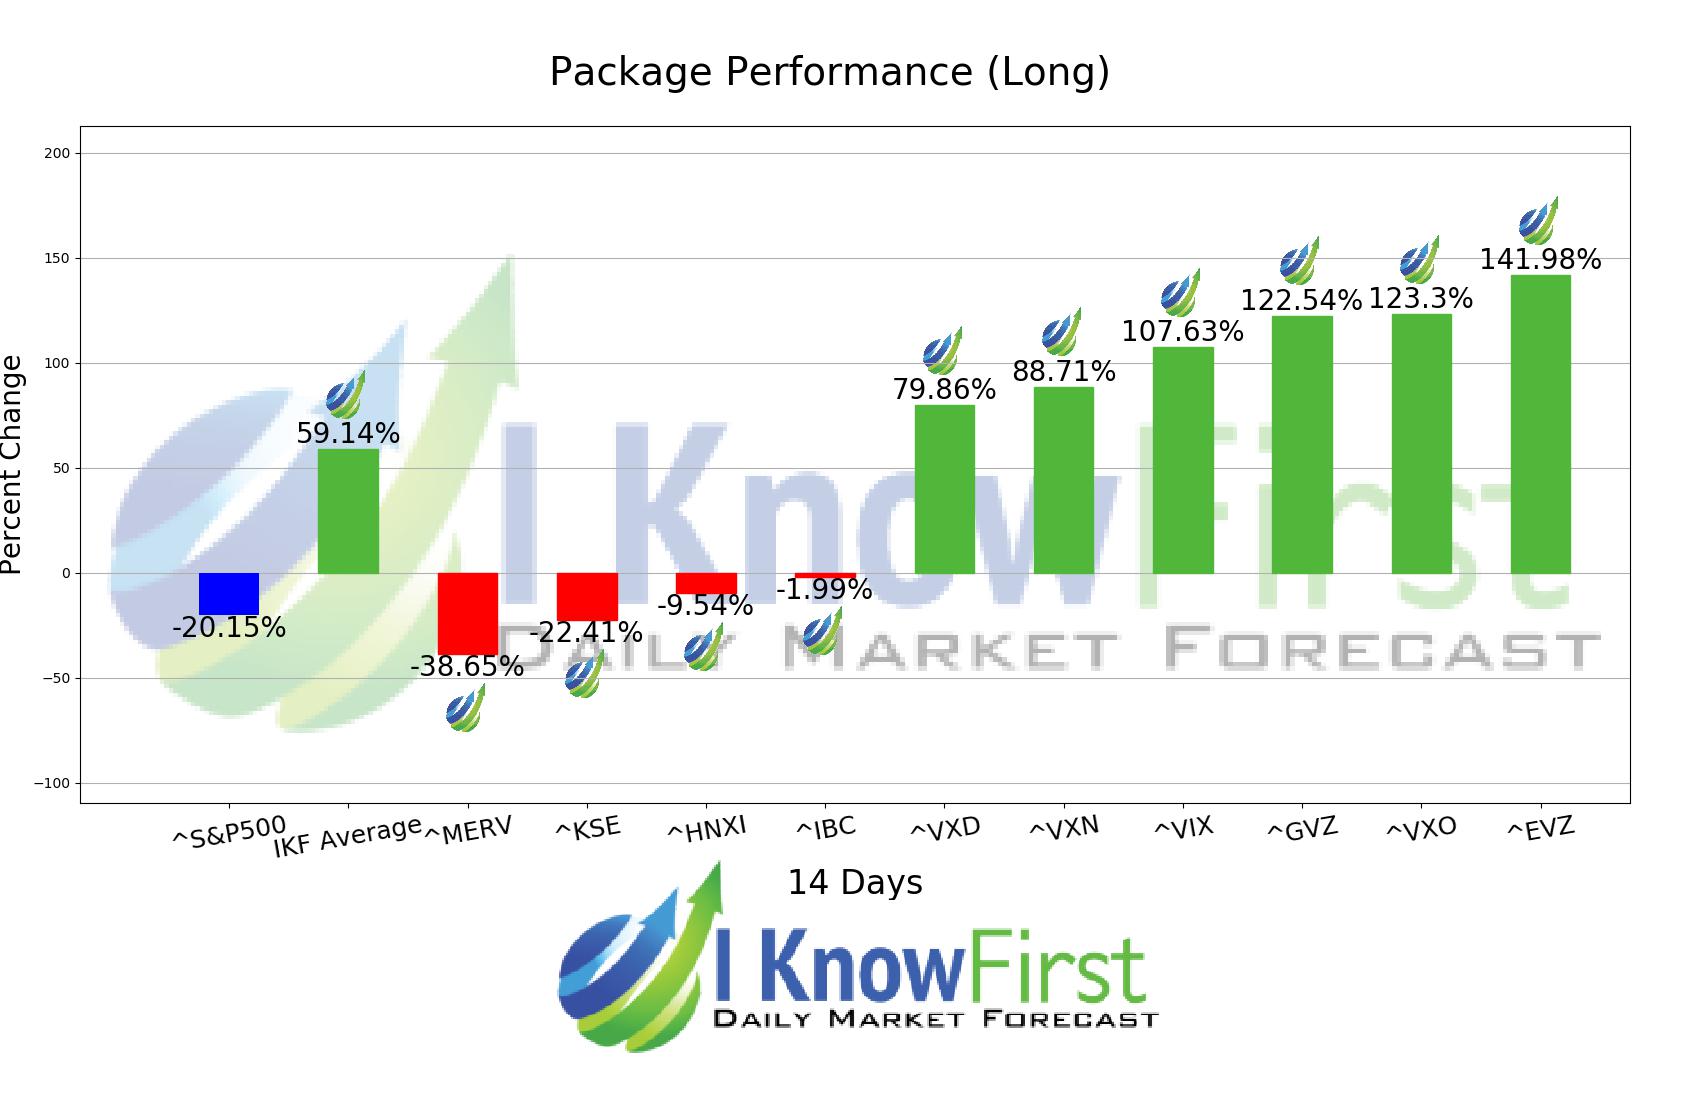

During the 14 Days forecast, the algorithm had predicted high returns for those seeking stock advice. The best performance in the short position came from ^TNX which registered a return of 25.35%. For the long positions the largest growth was registered by ^EVZ with a return of 141.98%, during the same period. The package itself, had an overall average return of 59.14%, in the long position, providing a premium of 79.29% over the SP500’s return of -20.15%. With regards to the short position, the package had an overall average return of 26.02%, providing investors with a premium of 46.17% over S&P500’s return of -20.15%. The I Know First’s Stock Market Algorithm accurately forecasted 6 out of 10 stocks, for the long position, and 8 out of 10 stocks, for the short position for this 14 Days forecasted period.
Algorithmic traders utilize these daily forecasts by the I Know First market prediction system as a tool to enhance portfolio performance, verify their own analysis and act on market opportunities faster. This forecast was sent to current I Know First subscribers.
How to interpret this diagram
How to interpret this diagram:
Algorithmic Stock Forecast: The table on the left is a stock forecast produced by I Know First’s algorithm. Each day, subscribers receive forecasts for six different time horizons. Note that the top 10 stocks in the 1-month forecast may be different than those in the 1-year forecast. In the included table, only the relevant stocks have been included. The boxes are arranged according to their respective signal and predictability values (see below for detailed definitions). A green box represents a positive forecast, suggesting a long position, while a red represents a negative forecast, suggesting a short position.
Please note-for trading decisions use the most recent forecast. Get today’s forecast and Top stock picks.