Stock Market Indices Forecast Based on Algorithmic Trading: Returns up to 77.09% in 3 Months
Stock Market Indices Forecast
This stock market forecast is part of the World Indices Package, as one of I Know First’s quantitative investment solutions. We determine our world indices forecast by screening our database daily using our advanced algorithm. The full World Indices Package includes a daily forecast for a total of 20 indices with bullish and bearish signals:
- Top 10 World Indices for the long position
- Top 10 World Indices for the short position

Package Name: Indices Forecast
Recommended Positions: Long
Forecast Length: 3 Months (1/19/21 – 4/19/21)
I Know First Average: 19.55%
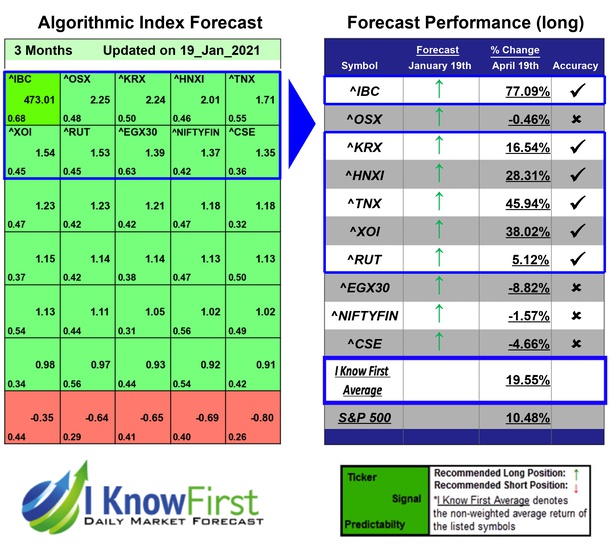
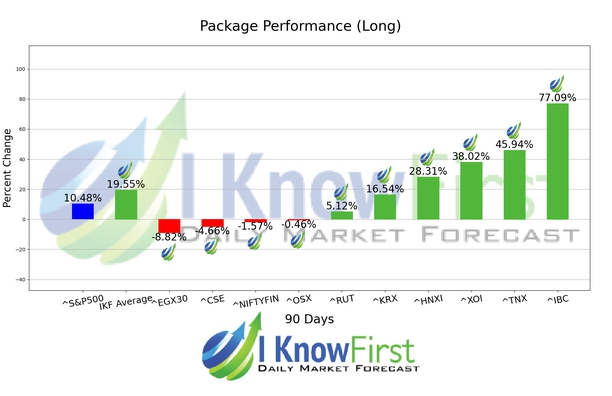
For this 3 Months forecast the algorithm had successfully predicted the changes in 6 out of 10 indices. ^IBC was the top performing prediction with a return of 77.09%. ^TNX and ^XOI saw outstanding returns of 45.94% and 38.02%. The package saw an overall yield of 19.55% versus the S&P 500’s return of 10.48% implying a market premium of 9.07%.
The IBC Index from the Caracas Stock Exchange (Venezuela), also known as the General Index, is a capitalization-weighted index of the 15 most liquid and highest capitalized stocks traded on the Caracas Stock Exchange (Bolsa de Valores de Caracas). The index was modified from a previous existing index on August 28, 1997, but essentially continues to be the same.
Algorithmic traders utilize these daily forecasts by the I Know First market prediction system as a tool to enhance portfolio performance, verify their own analysis and act on market opportunities faster. This forecast was sent to current I Know First subscribers.
How to interpret this diagram
Algorithmic Stock Forecast: The table on the left is a stock forecast produced by I Know First’s algorithm. Each day, subscribers receive forecasts for six different time horizons. Note that the top 10 stocks in the 1-month forecast may be different than those in the 1-year forecast. In the included table, only the relevant stocks have been included. The boxes are arranged according to their respective signal and predictability values (see below for detailed definitions). A green box represents a positive forecast, suggesting a long position, while a red represents a negative forecast, suggesting a short position.
Please note-for trading decisions use the most recent forecast. Get today’s forecast and Top stock picks.