Stock Market Forecast Based on Genetic Algorithms: Returns up to 39.99% in 3 Months
Stock Market Forecast
This stock market forecast is part of the World Indices Package, as one of I Know First’s quantitative investment solutions. We determine our world indices forecast by screening our database daily using our advanced algorithm. The full World Indices Package includes a daily forecast for a total of 20 indices with bullish and bearish signals:
- Top 10 World Indices for the long position
- Top 10 World Indices for the short position

Package Name: Indices Forecast
Recommended Positions: Long
Forecast Length: 3 Months (7/25/21 – 10/26/21)
I Know First Average: 5.39%

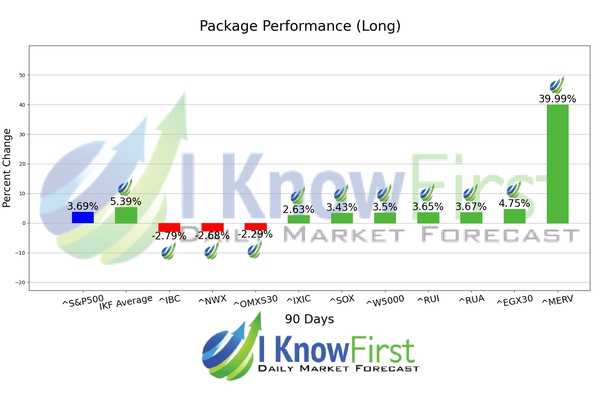
For this 3 Months forecast the algorithm had successfully predicted the changes in 7 out of 10 indices. ^MERV was the top performing prediction with a return of 39.99%. ^EGX30, and ^RUA had notable returns of 4.75% and 3.67%. The package’s overall average return was 5.39%, providing investors with a 1.70% premium over the S&P 500’s return of 3.69% during the same period.
The S&P MERVAL Index is the most important index of the Buenos Aires Stock Exchange. It is a price-weighted index, calculated as the market value of a portfolio of stocks selected based on their market share, number of transactions and quotation price. The base of MERVAL is set at 30 June 1986 = 0.01 Argentine pesos.
Algorithmic traders utilize these daily forecasts by the I Know First market prediction system as a tool to enhance portfolio performance, verify their own analysis and act on market opportunities faster. This forecast was sent to current I Know First subscribers.
How to interpret this diagram
Algorithmic Stock Forecast: The table on the left is a stock forecast produced by I Know First’s algorithm. Each day, subscribers receive forecasts for six different time horizons. Note that the top 10 stocks in the 1-month forecast may be different than those in the 1-year forecast. In the included table, only the relevant stocks have been included. The boxes are arranged according to their respective signal and predictability values (see below for detailed definitions). A green box represents a positive forecast, suggesting a long position, while a red represents a negative forecast, suggesting a short position.
Please note-for trading decisions use the most recent forecast. Get today’s forecast and Top stock picks.